Learning lessons and root cause analysis
Summary
Learning lessons from events that have happened is an important contributor to good risk management and general decision making. Root cause analysis is a key tool for learning lessons. Organisations use root cause analysis to provide a consistent and systematic approach to learning lessons from both successes and failures, and to apply them to improve future performance.
This guideline describes methods that can be adopted for learning lessons and generating improvements. It describes two root cause analysis approaches: fishbone analysis, and cause and effect analysis.
Organisations can benefit from undertaking ‘post-event’, ‘post-change’ or ‘post-decision’ analyses for all significant initiatives that they implement. They can also learn from unexpected events that might arise from a planned activity, or from external sources. The methods described here are generally applicable to all processes, initiatives and activities. They can be applied after an accident or adverse event, but there is often much to be learned by examining the consequences of planned work and the effects of unexpected beneficial outcomes.
Introduction
Background
There is much that an organisation can learn from its past successes and failures. These lessons can help it improve the quality and effectiveness of its processes and systems and optimise its controls.
Organisations benefit from using a consistent and systematic approach to learning lessons from events. This is called root cause analysis.
The word ‘event’ is used in this tutorial as a general term for something that has happened. An event may arise from something the organisation does, or it may be generated by external factors, or some combination. An event may have a positive effect on the organisation’s objectives (that we call a ‘success’) or a negative effect (that we call a ‘failure’).
Root cause analysis does not apply only to accidents, incidents or events that involve harm or detriment. Events with beneficial outcomes often contain valuable lessons as well.
Principles
The principles of this approach are that:
- Organisations learn just as much from successes as from failures
- It is important to understand the causes before summarising the lessons we have learned, to avoid converging on a conclusion before we understand how we came to be where we are
- Lessons must lead to actions that help the organisation to improve.
Purpose
While risk assessment can be seen as exercising foresight and planning for the future, good root cause analysis is the application of hindsight and learning from the past. Using root cause analysis to learn lessons is an important contributor to helping an organisation improve the quality and effectiveness of its processes and systems.
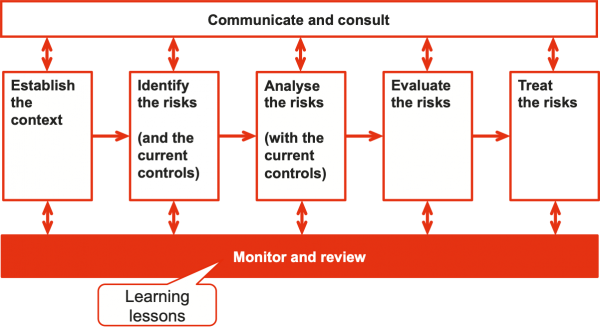
Within the risk management process, learning lessons is part of the step called ‘monitor and review’ (Figure 1). In this step the risk register, risks, controls and risk treatment plans are kept up to date. In part, this is achieved by analysing the causes of critical successes and failures, and then applying those lessons to further treat the associated risks.
Figure 1: Learning lessons as part of risk management
We choose to discuss learning lessons from the perspective of risk management and organisational improvement, but it is a general method that can be applied in several different contexts. The same process, based on root cause analysis, can be applied to more forensic analyses of things that have happened, such as major incidents or disasters. In these circumstances the focus might be on attributing responsibility, or on describing the factors that might distinguish between ‘bad management’ and ‘bad luck’.
Effective root cause analysis
A good method of root cause analysis will:
- Follow a recognised system
- Identify not only direct causes but also latent and root causes
- Be transparent, collaborative and involve relevant stakeholders
- Record its outcomes
- Identify and record lessons learned
- Result in agreed actions that treat the causes and lead to business improvements.
This tutorial describes two methods that satisfy these requirements.
- The first method, fishbone analysis, is suitable for high-level, everyday root cause analysis where there is little complexity.
- The second method, cause and effect analysis, is a more rigorous approach ideally suited for looking at situations where a series of events has occurred that led to the success or failure.
Whichever method is used, the analysis and outputs should be well recorded to show and preserve:
- The circumstances of the event, occurrence or change
- The nature of the successes and failures, in terms of the organisation’s objectives
- The root causes
- The lessons to be learned
- The improvement actions to be taken.
Actions should be allocated, tracked and closed out. Often a risk management information system is used for this purpose.
To ensure the integrity of the process and its outcomes, root cause analysis requires a trained facilitator. The facilitator should ensure that the process is carried out efficiently, help the participants group and assimilate similar causes, and guide the identification of lessons and improvement actions. If the event being examined had large adverse effects and there might be a tendency for the exercise to drift into recrimination and blame, then the facilitator should be independent or outside the immediate business area.
General process for learning lessons
Introduction
The general process for learning lessons is described in this section. Specific details of fishbone analysis and cause and effect analysis are provided in the sections that follow.
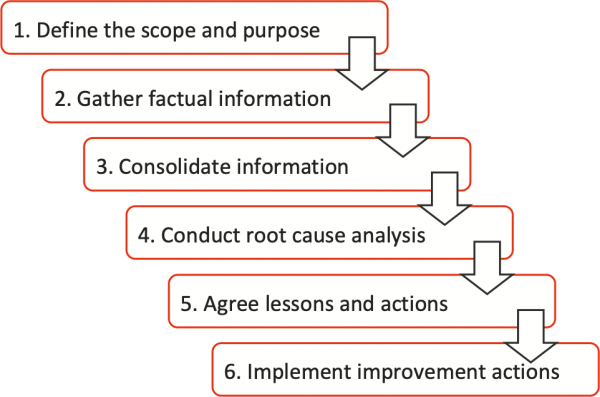
Whichever root cause analysis tool is used, we always follow the six stage approach shown in Figure 2 to agree the objectives, define the successes and failures, conduct the analysis, and draw out the lessons and the associated improvement actions.
Figure 2: Root cause analysis process
Task 1: Define the scope and purpose
The starting point for the process is the definition of the scope of the analysis, its purpose and the required outcomes.
The scope delineates the boundaries of the analysis: what is included and what is excluded. Normally the scope would be defined in terms of a particular event, decision, project step or change.
The analysis must contribute towards achieving the organisation’s objectives. This is the basis for deciding what successes and failures are to be examined. Actual performance against objectives and other performance requirements determines whether an outcome is desirable or not. The definition of these objectives is always an essential first step in the process; it is usually set out in the risk management context used as a foundation for the risk management process as a whole.
Defining the scope and purpose at the start of preparation for an analysis enables the next step of gathering information to be tightly focused and efficient. Even when the analysis is concerned with a single event, the relevant objectives and expected outcomes should be defined to place it in context and to provide a scale for evaluating the actual consequences.
Task 2: Gather factual information
It is important that sufficient time and resources are devoted to information collection and analysis before further analysis takes place. This is analogous to the ‘establishing the context’ step that precedes a risk assessment workshop within the risk management process.
The collection of accurate information about what occurred, when and where, is essential to ensure a comprehensive and reliable analysis of the root causes of the event and to remove any emotional overtones that might cloud the exercise. There are three rules to be followed in the collection of information:
- Act quickly. Information decays rapidly with time and needs to be preserved before people forget what happened, or situations are altered and changed. In particular, people’s recollections of what happened changes when they start to think about an event and discuss it with others. It is therefore important to act quickly to gather information and preserve information.
- Avoid changes or tampering. Even the way that data are gathered may change the information. Great care is needed in obtaining verbal information. It is easy to ‘put words into people’s mouths’ in the way that questions are asked.
- Only be factual. Only preserve what is there. Avoid all conjecture, particularly about the sequence of events. There is a great temptation to ‘fill in the gaps’, to make the information fit a pattern or a pre-conceived situation or cause. In particular, no one should start to think or say ‘What caused this?’ Those who gather information may start to corrupt information without thinking. They should practice the personal discipline of not thinking or discussing amongst themselves ‘What caused it?’, ‘Why did that happen?’ or similar trains of thought.
Only collect information that is pertinent to the scope of the root cause analysis. It is often useful to start with the immediate circumstances of the event, and then to move out to successively more distant points in time and location before and after the event. This is sometimes described as the ‘ripple approach’. It is particularly useful to enable us to understand the preconditions and other events that led up to the event. It also enables us to analyse how we responded after the event and to gain an appreciation of the consequences upstream and downstream of the event.
Task 3: Consolidate the information
All the information collected should be collated and organised to facilitate the subsequent analysis. Care is needed here only to present the factual information collected and to avoid ‘filling in the gaps’. If a gap in information exists, this should be made clear and noted. Often the fact that information is absent is itself relevant to the subsequent analysis.
Analysis of the information should be limited to consolidation of different sources of information and their objective interpretation. It is vital that at this stage there is no conjecture as to causation and no bias is applied in terms of the validity of the information or the value of one piece of information over another. Often, the existence of two competing pieces of information is, in itself, useful information.
The relevant objectives and performance criteria (Task 1) can provide a structure for collating and analysing the information. This can be similar to the method used in preparing for a risk assessment.
Information can be collated according to:
- Relevant stakeholders and their objectives
- External factors and implications
- Internal factors and implications.
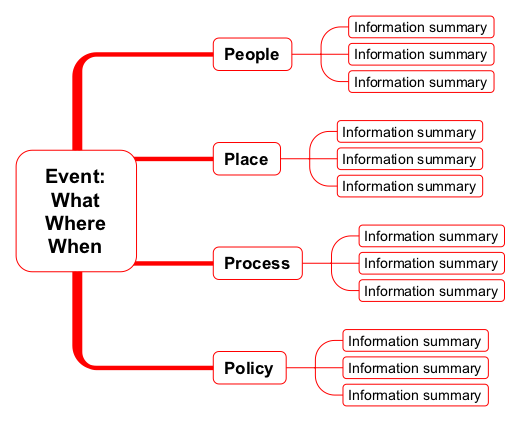
Information can also be collated and presented in a graphical format. This is useful where much of the information is visual or based on figures and charts. Information trees are useful in this instance.
- Practically an information tree can be drawn on a large white board or on a large sheet of paper. It can also be assembled as an electronic file using mind-mapping software. Figure 3 shows an example. The value of using software for this purpose is that other pieces of information such as documents, videos or photographs can be attached by hyperlink so that the tree can be used as a dynamic focus for discussion in a workshop or meeting.
- The tree is used to assemble and associate all the related pieces of information. These should only be summaries of the factual information recorded. Any conjecture and interpolation, extrapolation or interpretation should be avoided.
Figure 3: Example of an information tree
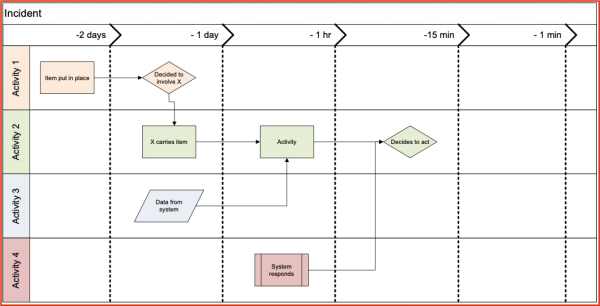
If the event is concerned with a sequence of actions that are time dependent, then it is useful to represent these actions and their relationship through time in a chronology chart, the event timeline. These are also often called ‘swim lanes’.
Work back in time from the event to create a chronology chart. It is better to work backwards rather than forwards, as working forwards can lead to cause-effect relationships being addressed prematurely, corrupting the information. Only factual information should be displayed and accurate times should be given. Figure 4 shows an example of a chronology chart.
Figure 4: Example of a chronology chart
Task 4: Conduct root cause analysis
Prepare a briefing note for the workshop
A root cause analysis workshop is most efficient if the participants are briefed and are able to prepare beforehand. For this reason, whoever is facilitating the workshop should develop and send out a briefing note that summarises all the information collected and correlated so far.
Typically, the briefing note would contain summary information about:
- The scope
- The objectives, outcome criteria and actual performance against them
- The event in terms of what happened, where and when
- The information collected including the information tree and chronology chart if they are used
- Any figures, pictures, plans or maps that might inform the participants
- The relevant external and internal background factors and information
- Relevant controls
- Extracts from any relevant risk registers.
Choose and invite workshop participants
Typically at least three and no more than 15 people should attend a root cause analysis workshop. Workshop participants should be chosen based on their ability to contribute to the analysis and their specialist expertise and experience. Seniority should not be the sole criterion and spectators and observers should be avoided, as should dominant senior personnel whose presence might inhibit others from expressing themselves freely.
Provided accurate factual information is available, witnesses of an event and those directly involved in it may not need to participate. This avoids the analysis becoming a court of inquiry.
The facilitator does not have to be independent of the organisation, but should be fully independent of the activity, area or management structure associated with the event. It also helps if the facilitator is familiar with the activities and environment concerned and has been trained in root cause analysis.
Having a recorder is also helpful.
Conduct the root cause analysis
The facilitator should introduce the process to be followed by the workshop and present a summary of the information in the briefing note. The participants should be invited to ask questions about the information if they require any clarification. The facilitator should caution the participants only to ask questions about the facts; there should be no discussion at this stage about causation.
The participants should discuss the factual information available that defines the event that occurred in terms of:
- What occurred
- When it occurred
- Where it occurred.
Complete agreement should be obtained from all participants on the full descriptions of these terms and they should be recorded.
The workshop should then proceed to the detailed root cause analysis, using either the fishbone method or the cause and effect method. While software can be used to construct fishbone diagrams or cause and effect trees, often it is more effective to use an electronic white-board or a flip chart with Post-it™ Notes and pens.
The remaining tasks from Figure 2, the generic list of tasks required to carry out an analysis, are described next, followed by detailed descriptions of the two analysis methods. Some reasons for choosing one method or the other are given later in Table 2.
The outcomes from the analysis are used in Task 5 and Task 6.
Task 5: Agree lessons and actions
The facilitator should encourage the meeting participants to examine the outcomes of the analysis to draw out lessons. If fishbone analysis is used, this will involve drawing conclusions from inspection of the diagram. For cause and effect analysis, the root causes are at the ends of the tree where each branch stops.
The lessons should be recorded and the participants should agree actions associated with each. There should always be at least one action recorded for each lesson. The actions can involve:
- Modifying the uncertainty to prevent similar failures occurring again, or to repeat the successes
- Modifying the decision taken previously
- Promulgating lessons to interested parties in the organisation
- Embedding the lessons in systems and procedures and the way we do things to ensure that similar failure events cannot occur again or that similar successes always occur.
Improvement actions should be agreed. In particular, options for modification should be considered. As root cause analysis identifies the root causes of an event, in most cases modification will focus on changing the likelihood of similar events happening rather than the consequences.
Task 6: Implement improvement actions
The output from the analysis, and in particular the improvement actions, should be recorded in the organisation’s risk management information system. Tasks should be created, allocated to managers with agreed timelines and the progress towards their completion should be tracked and reported on using the system.
Whichever method of root cause analysis is used, the outcomes of the workshop should be preserved. If software is used, a copy of the relevant files should be stored on a shared drive of a file server and flagged as ‘read only’. If hard copy materials are used, then copies should be taken. It is often useful to create a photographic record of any charts or diagrams created in the workshop. This information demonstrates the deliberate effort made to learn from the past, and it can provide a valuable resource for other investigations or to assist in developing and extending participation in root cause analysis.
After the workshop, a report can be created that is based on the briefing document, updated to include the outcomes. The report should contain the conclusions and recommendations. All participants and interested parties should receive a copy.
Fishbone (Ishekawa) analysis
Background
Dr Kaoru Ishikawa, a professor in the Faculty of Engineering at The University of Tokyo, invented the fishbone diagram in 1982 as part of his research into quality systems. The fishbone diagram is a simple analysis tool that provides a systematic way of looking at effects and the causes that create or contribute to those effects.
The fishbone diagram is used to associate multiple possible causes with a single event. It assists in categorising in an orderly manner the many potential causes of events and in identifying root causes. Thus, for a particular success or failure, a diagram can be constructed to identify and organise possible causes.
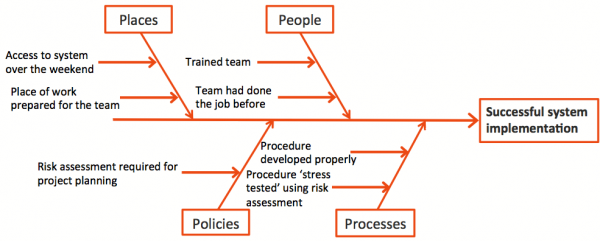
A generic fishbone structure is shown in Figure 5. The primary branch represents the effect (the success or failure) and is typically labelled on the right side of the diagram. Each major branch of the diagram corresponds to a major cause (or class of causes) that directly relates to the effect. Minor branches correspond to more detailed causal factors. Figure 6 shows an example of this form of analysis applied to a success.
Figure 5: Generic fishbone structure
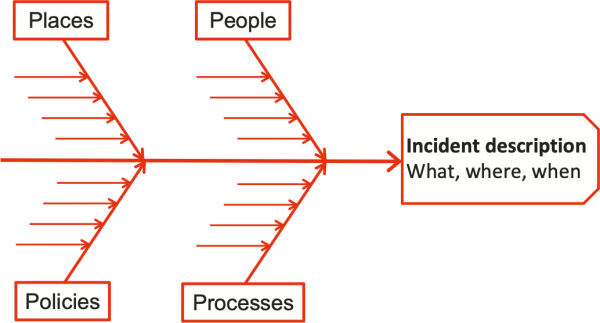
Figure 6: Fishbone example for a success
To be most effective, the analysis requires a trained facilitator, particularly to help the participants group and assimilate similar causes and to move on to the identification of lessons and improvement tasks.
Uses and limitations
Fishbone analysis is a good choice:
- Where there appears to be a simple cause and effect relationship
- To collect data and facts and display them on one diagram
- To perform a simple analysis of a system and how it is performing
- To present lessons on an ongoing basis as part of project risk management during project execution
- As an effective communications device for presenting simple causation information to others.
Fishbone analysis should not be used:
- For complex systems, processes and events with many potential and interrelated causes, such as analysing a major emergency where many internal and external stakeholders interacted in the developments leading up to the subject of the analysis
- For successes and failures where very rigorous analysis is justified by the magnitude of the gain or loss involved, such as where the financial impact is very large, the event involves a regulatory breach or people have suffered serious injury.
In these cases, cause and effect analysis should be used.
The fishbone analysis workshop
The basic steps in the analysis are:
- Draw the fishbone diagram on a white board or a large sheet of paper.
- Agree with participants a statement of what actually happened and write this in the head of the fish. Define that statement in terms of what occurred, where and when.
- Label the bones of the fish with the category labels of People, Policy, Process and Place. In the context of ERM, this ‘4 Ps’ is the most useful category set. It is possible to have more than four bones or to use a different set of categories but the general intent should be to keep the analysis simple and to avoid unnecessary complexity. (Other categories include ‘4 Ms’ – manpower, machines, materials and methods – and ‘4 Ss’ – skills, systems, suppliers and surroundings.)
- Use an idea-generating technique such as brainstorming to identify the causes within each category that may have led to the event being studied. The participants should ask, for example: ‘What are the people-related causes for this?’ Write the causes on the relevant bone of the fish or on Post-it™ Notes that are positioned on the bones.
- Repeat this approach, if necessary, with each cause under the category to produce sub-causes. Ask ‘What caused it?’ in each case.
- Continue until you no longer get useful information when you ask ‘What caused it?’
- Look across the fishbone and see if any items can be grouped into most likely causes. Using Post-it™ Notes for the exercise helps with this.
- The participants should agree the discrete lessons and these should be written on another sheet of paper by the facilitator. An action should be written for each lesson that, when taken, will increase the chance of the success being repeated or the failure being prevented from happening again.
- All lessons and actions should be recorded in the organisation’s risk management information system. Actions should be allocated to managers for completion, with assigned completion dates.
Cause and effect analysis
Background
Cause and effect analysis should be used whenever the study of events has to be more rigorous or structurally detailed than fishbone analysis can support. Because it is not prescriptive and relies on a methodology and rule set, it is widely applicable to all events, systems and situations.
Use this method:
- For all types of events, both successes and failures
- When a complex interacting set of causes is involved
- When the true root causes are not clear, which is often the case.
Cause and effect analysis is not normally used where there is a need only to assemble well-known and non-linked causes, when a simpler process like fishbone analysis would be adequate and take less time.
Cause and effect analysis involves the following four ‘principles’:
- Causes and effects are similar things in the causation chain, it just depends where you start and stop. A cause leads to an effect, which becomes the cause for another effect.
- You only identify the ‘root causes’ when asking ‘What causes that?’ gets you to a point where you can no longer exercise control and detailing further causes is of no benefit.
- Each effect should have at least two causes. One cause is likely to be a ‘condition’ or ‘latent cause’, something that exists because of internal or external circumstances. In contrast, another cause is likely to be an ‘action’, relating explicitly to something that someone did.
- There should be a clear mechanism by which causes lead to effects. Typically an effect only arises if its causes existed at the same time and place as the effect.
The cause and effect analysis workshop
The basic steps in the analysis are:
- Agree with participants a statement of what actually happened and write this down as the base of the cause and effect tree. Define that statement in terms of what occurred, where and when.
- Starting with the base event, ask ‘Why?’ and ‘What caused that?’ and record the answers, linking them to the base event. This can be done with Post-it™ Notes on a whiteboard or a sheet of paper, or it can be done within a software tool.
- Record each cause in a noun-verb expression (e.g. ‘something happened’, ‘something didn’t happen’, ‘someone did something, ‘someone didn’t do something’).
- Continue asking ‘Why?’ and ‘What caused that?’ for successive causes, recording the causes and linking each to the preceding cause, to build up the cause and effect tree. Keep asking ‘Why?’ until a point is reached where it doesn’t make sense to continue. Try to maintain a logical, step-by-step sequence and avoid leaping many steps to what participants think might be a root cause.
- Starting at the base event, review the causes and their descriptions to make sure they are assembled in a logical sequence. If a gap emerges then create a new cause to provide a link between two parts of the tree. Generally, you should structure the tree so that each effect is always caused by at least two other causes, a ‘condition’ cause and an ‘action’ cause. This will not always be so but it is a useful guide in most cases.
- Record evidence to substantiate each cause in the tree. Note or cross-reference the evidence under each cause description.
- When it does not make sense to continue asking ‘Why?’, end each causation chain with a ‘Stop.’
A decision to stop a causation chain should be supported by one of the following reasons:
- The necessary understanding or a desired endpoint has been reached, such as a limit or a required level of quality
- The next cause is outside our control and there is no practical way of influencing it or the way it affects the situation or event we are examining
- There is a new primary event that is worth exploring separately in a new cause and effect tree
- Other causal paths are more productive, if it is clear this cause path provides no value, for example for causes like ‘wood burns’ or ‘the sky is blue’
- More information is needed, if you want to add it to the action item list for further investigation.
Once the tree is complete, it should be re-examined to ensure that:
- There is a logical flow
- All causes are described using the noun verb form
- All paths end with a stop, where there is no point in seeking more detail
- Wherever possible, information is available to substantiate each cause.
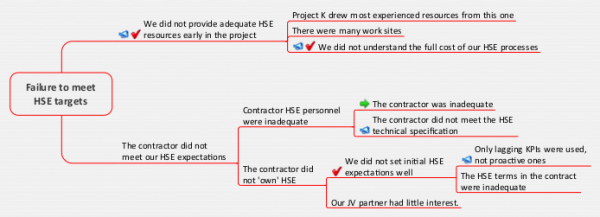
An example of the kind of tree assembled during cause and effect analysis is shown in Figure 7. In the diagram, the green arrow indicates that there was another detailed cause and effect tree to address the root causes of ‘The contractor was inadequate’. The red ticks indicate causes within the organisation’s control. Megaphones indicate there are associated lessons; see Table 1. ‘Stop’ points are omitted.
Figure 7: Example of a cause and effect tree
Converting lessons into improvements
Root cause analysis allows root causes to be identified and lessons to be learned. However, learning lessons cannot be an 'ad hoc' process, and it will be inefficient if left to chance. Specific actions are needed to ensure the organisation converts those lessons into actions and accountability that lead to lasting improvements.
Table 1 is an extract from an analysis of health, safety and environmental performance in an oil and gas development project, linked to the cause and effect tree in Figure 7. It identifies the lessons and documents the agreed improvement actions.
|
Lesson |
Improvement actions |
|---|---|
|
We did not provide adequate HSE resources early enough |
Appoint HSE personnel at an early stage of every project |
|
We did not understand the full cost of our HSE processes |
Ensure adequate HSE resources are costed into the project estimate |
|
Only lagging KPIs for HSE were used |
Set realistic and proactive KPIs, not just lagging indicators |
|
The contractor did not meet the HSE technical specifications |
Include HSE requirements in tender documents and in the technical evaluation criteria for selecting contractors |
Choosing an approach
Table 2 shows some of the main comparative features of fishbone analysis and cause and effect analysis.
|
Factor |
Fishbone analysis |
Cause and effect tree |
|---|---|---|
|
Application |
The analysis can be applied to both successes and failures |
The analysis can be applied to both successes and failures |
|
Situation |
Fishbone analysis is best for simple situations with straightforward causes It may also be used where root causes are relatively easy to identify but it is nevertheless important to engage several people in the analysis and arrive at an agreed conclusion |
Cause and effect trees are best for complex situations with many linked causes and root causes that are not easy to identify |
|
Ease of initial analysis |
Fishbone diagrams are relatively easy and straightforward to generate |
Time and thought are needed to identify causal sequences and mechanisms |
|
Ease of identifying root causes and lessons |
Time and thought are needed to draw out explicit lessons from the fishbone diagram |
Root causes are available directly from the cause and effect tree, making lessons easier to identify |
|
Level of detail |
Fishbone diagrams usually only contain low to medium detail, so this approach is not recommended if detailed outcomes are needed |
Cause and effect trees can be detailed and generate very detailed outcomes, so this approach is recommended for more forensic analysis or where there is a lot at stake |
|
Overall time required |
This form of root cause analysis can often be completed relatively quickly |
This form of root cause analysis requires time for preparation and analysis |
Reference
IEC 62740-2015 Root cause analysis (RCA). International Electrotechnical Commission, Geneva.