Risk management for major procurements
The material here formed the basis for a paper presented by Dr Dale Cooper, Director, to the 11th International Federation of Purchasing and Materials Management World Congress, Sydney, 17-19 November 1999. Note that the Australian and New Zealand Standard AS/NZS 4360 has been superseded by ISO 31000 and IEC 62198.
Summary
This paper outlines qualitative and quantitative applications of risk management in the procurement process, using case study examples to illustrate the kinds of outcomes and benefits that can be obtained. The qualitative approaches are based on the Australian/New Zealand Standard, AS/NZS 4360:1999. The quantitative methods extend this framework to more complex analyses. Although the examples are based on large and complex procurements, the approaches can be applied to smaller purchases, with similar kinds of benefits.
Introduction
Managing risk is an integral part of good management, and fundamental to achieving effective procurement of goods and services, particularly for large scale or complex procurement activities. Risk management may involve functions many managers do already in one form or another – sensitivity analysis of a financial projection, scenario planning for a procurement appraisal, assessing the contingency allowance in a cost estimate, negotiating contract conditions or developing contingency plans. Although most managers do not use the term 'risk' when they undertake these activities, the concept of risk is central to what they are doing and to obtaining good procurement outcomes.
Systematic identification, assessment and treatment of risk contributes significantly to the success of procurement. Conversely, poorly managed procurement risks may have wide-ranging adverse implications for the achievement of objectives.
There are three keys to managing procurement risk effectively:
- Early and systematic identification and assessment of risks and development of plans for handling them
- Appropriate allocation of responsibility to the party best placed to manage each risk
- Adoption of an overall risk management approach commensurate with the importance of the purchase and the risks involved.
Formal risk management is recommended for major procurements for a number of reasons.
- Their size and significant capital outlays imply there may be large potential losses unless they are managed carefully.
- They often involve unbalanced cash flows, requiring large initial investments before any returns are obtained. In these circumstances, and particularly for assets with potentially long lives, there may be significant uncertainty about future cash flows and the benefits may not all be readily measurable in cash terms. This can make it difficult to ensure that the anticipated balance between tangible and intangible costs and benefits that was originally envisaged is actually achieved.
- They may involve a range of participants, often with divergent interests and different capabilities for managing risks.
- They may be inherently complex or risky, involve the development or use of new technology, or require unusual legal or contractual arrangements. Specific risk management may also be required when there are important political, economic or financial aspects, sensitive environmental, social or safety issues, or stringent regulatory or licensing conditions to be met.
The approaches and techniques discussed in this paper are not just for large or complex procurements. The framework for identifying, analysing and assessing risks and developing plans for dealing with them can be applied equally to smaller and simpler procurements and routine purchasing activities, with significant benefits for those involved.
The risk management standard AS/NZS 4360:1999
Systems engineering and related approaches have been used for managing procurement risks in technical acquisitions for many years (see, for example, [7]), but they were often limited in their scope of application. Australia leads the world in having a national Standard for risk management, AS/NZS 4360:1999 [11], with wide applicability. The standard sets out a generic approach to managing any kind of risk, including procurement risk. Use of the Standard can help an organisation demonstrate that its risk management practices are sound and up to date. With the Standard gaining increasing attention around the world, and likely to be taken as a model by other countries, it is a recommended starting point for anyone concerned with the subject.
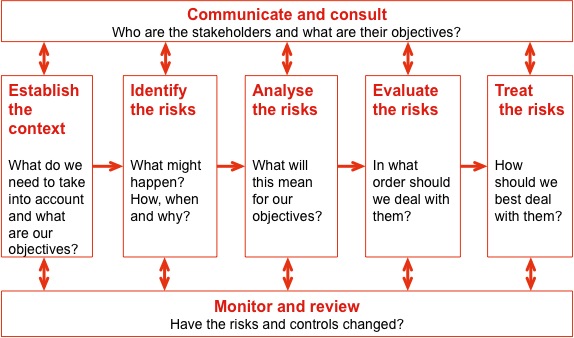
The generic process of the Standard, illustrated in Figure 1, has to be tailored to a particular application. The experience required to do this in a range of areas has been growing steadily since the first Commonwealth procurement risk guidelines in 1992 [2] and the NSW Government Guidelines in 1993 [9], followed by the first edition of AS/NZS 4360 in late 1995 and the corresponding Commonwealth guidelines in 1996 [3]. The Standard offers a framework within which an organisation can set up a strategic approach to risk management, embracing detailed processes, procurement activities, and the management of the business as a whole.
Figure 1: The risk management process in AS/NZS 4360:1999
Risk management and procurement
Risk management can be applied usefully at all stages of a procurement. Table 1 shows some examples. (Note that risk management processes have wide application in other stages in the life cycle of assets, omitted from this table, including operation, routine maintenance, major capital maintenance and refurbishment, and disposal.)
Table 1: Procurement stages and risk management application examples
|
Procurement stage |
Application examples |
|---|---|
|
Objectives and requirements analysis |
Assessment of internal skills needed to assure the success of the process (for example, for procurement of services by outsourcing) |
|
Formulation of procurement strategy |
Incentive contract performance and fee modelling Development of equipment acquisition strategies |
|
Capital evaluation |
Capital evaluation of major spending initiatives (some examples from our recent experience include new mine development, IT systems acquisition, infrastructure provision and selection of capital equipment within major developments) |
|
Analysis of options |
Exploration of market testing strategies Quantitative analysis of strategic options, with cost and risk trade-offs Assessment of alternate technologies for major plant upgrades |
|
Formulation of proposals for funding approval |
Board, Cabinet and Ministerial submissions for approval of major projects Applications for additional funding |
|
Preparation of procurement documents |
Detailed development of Requests for Tender documents that address risks appropriately |
|
Preparation of tender evaluation plans |
Preparation and assessments of key delivery requirements for Tender Evaluation Plans |
|
Evaluation and selection of tenders |
Evaluation of tender submissions taking account of bidders’ capacity to manage the risks involved |
|
Negotiation and signature of contracts |
Review of negotiation priorities ensuring effective risk allocation |
|
Implementation and delivery |
Implementation risks, including approvals, technical, construction, budgets, phasing, milestones |
|
Commissioning and handover |
Development and management of test and commissioning, transition, delivery |
The following sections of this paper provide case study illustrations of risk management processes in procurement activities. The cases show varying degrees of complexity and sophistication, ranging from simple qualitative applications of the Standard through to detailed quantitative analyses of uncertainty. Further examples and extensions of the approach are provided in Cooper [4].
Qualitative case study: contract negotiation priorities
This case concerns the acquisition of high-technology defence supplies, including development and adaptation to allow fitting to an aircraft. The procurement had progressed to the stage where a preferred tenderer had been selected, and it was then necessary to develop a strategy for conducting the contract negotiation process. This risk assessment was designed as an initial input to the development of such a strategy.
A workshop was held to identify the risks and assign priorities to them, with a particular focus on those risks that were important for contract negotiation. A secondary outcome was a wider list of risks to the procurement itself. The approach followed the Standard AS/NZS 4360, suitably adapted for this task.
The criteria for the procurement were indicators of the consequences of risks. There were two classes of criteria, one related to the functional performance of the supplies and the other to the success of the contract (Table 2).
Table 2: Criteria for contract negotiation
|
Functional criteria |
Functional capability |
Includes operational and training performance |
|---|---|---|
Delivery schedule |
Time to operational service |
|
Life cycle cost |
Through-life costs |
|
Supportability |
Includes reliability, availability, maintainability, support processes |
|
Safety |
Includes safety and airworthiness of the aircraft |
|
|
Contract criteria |
Acquisition cost |
Capital cost |
Industry involvement |
Local industry contribution |
|
Good management |
Probity, processes, systems |
|
Good contract |
Beneficial and good value for money for users; few disputes |
A Risk Work Breakdown Structure, based on the contract and delivery activities, provided the principal structure for the risk identification tasks. For each risk, the workshop participants made a judgement about its likelihood of arising and the potential consequences on the criteria if it did arise, using simple rating scales. Two sets of consequence ratings were developed, one for functional impacts and one for contract impacts. The likelihood and consequence ratings were used to determine two sets of initial risk priorities, in four grades from Extreme down to Small, one for functional aspects and one for contract aspects.
The initial priority ratings were reviewed and a single agreed priority was assigned, based on the overall importance or the risk for the contract negotiation. Risks assigned a high priority were those requiring the most attention in the preparation and conduct of the negotiation. Responsibilities for treating each risk were also assigned. A total of 157 risks was identified and assessed, summarised in Table 3.
Table 3: Summary of contract negotiation risk priorities
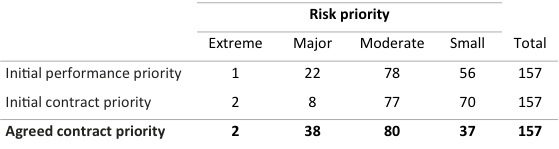
Two risks were rated Extreme (Table 4). They both relate to the complex relationships and responsibilities that exist between the organisations involved in delivery of the ultimate capability required. Both required additional detailed analysis as a matter of urgency.
Table 4: Extreme risks for contract negotiation
- Risk 10.22: The complexity of organisational and schedule relationships leads to inability to assign responsibilities, delay, and potentially project failure. The general complexity of the relationships has major implications for the contract negotiations as well as the conduct of the delivery. Clarifying the relationships in detail will be needed. The development of a Responsibility Assignment Matrix and a detailed Project Master Schedule would appear to be essential first steps.
- Risk 10.17: The draft contract envisages the sponsor carrying liability for provision of data and equipment, some of which is outside our control, leading to delays. This risk incorporates some of the immediate contractual consequences of Risk 10.22. The complexity of the relationships between the parties will necessarily involve the sponsor accepting additional risks and liabilities. The contract structure will have to reflect this as far as possible, to provide the sponsor with such contractual protection as can be negotiated.
The two Extreme risks and the 38 Major risks were key inputs in developing the contract negotiation strategy.
Quantitative risk analysis
General approach
Quantitative risk assessments extend the process in the Standard to more detailed numerical analysis of uncertainty, usually in the context of a model of the procurement activity being examined. Often the model is a financial spreadsheet, incorporating the main cost or schedule aspects of a procurement and their inter-relationships. Quantitative analyses come into their own when a view of the overall risk associated with a procurement is needed, such as when:
- Setting targets or accepting commitments
- Evaluating the realism of estimates
- Selling a procurement proposal on the basis of confidence in the forecast outcome
- Assessing the return on major investments at pre-feasibility or feasibility stage
- Choosing between alternative investments
- Choosing between alternative technologies with different risk profiles.
Risk modelling may be viewed as an extension of conventional project or business forecasting and modelling (Figure 2). Generally, a conventional spreadsheet is the starting point, such as a cash flow model of the net present value (NPV) of a capital investment. The main elements of the model are examined to determine the risks, those factors or events that might cause the elements to vary, and the likely management responses to variations are considered. The elements, risks and responses are used to develop quantitative descriptions of the variability in the model, in the form of distributions that replace the numbers in the spreadsheet. Of course, this requires special software, often in the form of a simple spreadsheet add-in like @Risk [10]. The distributions are combined through the model structure to generate distributions of the key variables need for decision making, such as the distribution of capital cost, NPV or rate of return (ROR) (Figure 3).
Figure 2: Outline of the quantitative risk analysis approach
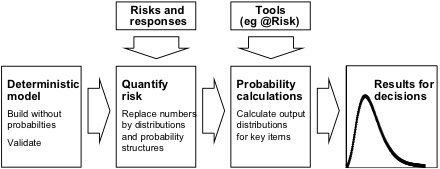
Figure 3: Quantitative risk spreadsheet
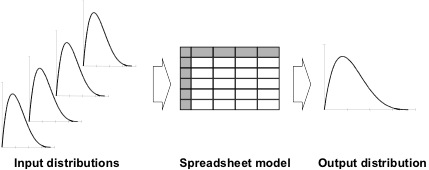
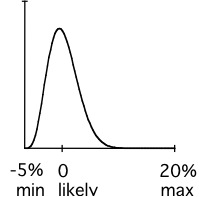
Figure 4 shows an input distribution in density form, in this case estimated as a percentage variation around a base value. Such a distribution might be used to model the variation in an estimate of a cost at some time in the future, where the base cost is linked to a standard cost estimating process and the risks are ‘normal’ estimating variations.
Figure 4: Percentage variation about a base value (density form)
Output distributions can be displayed in several forms. The one most people find immediately useful is the range of likely outcomes, and the risk of exceeding targets in that range. Figure 5 shows a typical example.
Figure 5: Risk of exceeding cost target (reverse cumulative form)
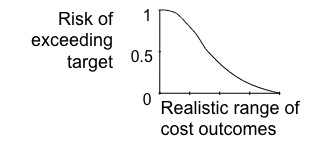
If Figure 5 represented the capital estimate for a procurement, for instance, it would help in setting an overall budget target, generally towards the right hand end, and how much to release initially to the project budget, usually somewhere nearer the middle. It would also make it clear if earlier expectations had been realistic. Anything falling to the left of the range shown has to seen as very risky for all concerned.
Risk models provide considerable information about the business or project being analysed. They can show:
- The realistically likely range of outcomes to expect
- The risk (or probability) of exceeding a target as a function of the value of the target
- The relative magnitude of various sources of uncertainty
- The sensitivity of the uncertainty in the output to uncertainty in each input, highlighting the major risk drivers (which might not be those expected!).
Quantitative risk assessment and modelling are described in detail by Cooper and Chapman [5] and Grey [8].
Quantitative case study: cost estimation
This case describes the application of quantitative risk analysis techniques to cost estimation, a key task in the procurement planning process [5, 6]. Risk analysis in cost estimation is important for procurement managers and end users, to enable them to plan for and source funding, to understand the kinds of responses and prices they might expect when offers are invited, and to structure the allocating and pricing of risk in the contract. For suppliers, it is important to enable them to estimate contingencies and profit margins.
A large hydroelectric development in a remote area had been proposed and detailed preliminary studies had been completed. However, there was some doubt about the economic viability of the project because the energy environment had become less certain. The end users saw a need to re-examine the capital costs and risks. In particular, it was felt the original estimates may have been optimistic and the contingency allowances may have been too small. The criterion of interest was the total cost of the procurement under ‘normal’ circumstances, that is, what the procurement might cost in the absence of catastrophic events and force majeure incidents. (This is a very limited objective, with implications for the kinds of risks that are considered in the analysis.)
The original cost estimate was derived from a traditional engineering analysis of preliminary design plans and drawings. It decomposed the project into a number of elements representing the main activities and items of equipment to be procured, with each element further decomposed into labour, material, equipment and indirect cost components. Cost variability and risk was included in the original estimate in the form of a contingency allowance, calculated as a proportion of the other procurement costs.
The method for reviewing the risks was that outlined in Figure 2 (although @Risk was not used for the calculations). The analysis considered a range of ‘normal’ risks for procurements like this, concentrating on those risks that might affect the total cost of the project (Table 5). Quantity and unit cost risks have direct affects on the cost estimate. Schedule risks cause delays, and have effects on indirect costs as well as on the present value of future spending. Risks common to all elements were identified explicitly as ‘global risks’.
Table 5: Examples of risks for the hydroelectric procurement
|
Quantity risks |
Design Engineering approach Definition Rock quality Ground contours |
Overbreak River bank characteristics Compaction Estimation |
|---|---|---|
|
Unit cost risks |
Engineering approach Weather Processing Formwork re-use Royalties |
Placement Dewatering Engineering & management rates Estimation |
|
Schedule risks |
Weather Seasons |
River levels (high & low) Equipment delivery |
|
Global risks |
Labour-related factors |
Bidding environment |
Note that the same process can be used for estimating variations in revenues where the objective of the risk analysis is to evaluate profit projections or NPV. The equivalent to Table 5 might include sales volume and sales margin risks in place of quantity and unit cost risks, as well as schedule and global risks.
Abnormal or catastrophic sources of risk having the effect of force majeure were outside the scope of the review. They were treated as project conditions, in the sense that the analysis was conditional on them not arising. They included risks such as major design or site changes, water charges, labour problems, land acquisition, major floods and jurisdictional and regulatory processes. In this particular case the objectives of the risk analysis were limited to a consideration of the cost estimate and its more-or-less normal variations. In other circumstances and with wider objectives these catastrophic risks might be central to the procurement and they would be analysed and assessed in detail.
For each element in the estimate, the risks that might cause the cost of the element to vary were identified, and, where appropriate, the responses to those risks were considered. For each element, the effect of each risk on the cost was quantified as a distribution of percentage variation from the base estimate, like that in Figure 4; the percentage distributions for each risk were combined; and the result was scaled to generate a distribution of cost for the element measured in dollars.
The cost distributions for the elements were added, taking into account the correlations and linkages between the elements, to generate a distribution of total cost for the procurement. This distribution was used to evaluate the adequacy of the contingency allowance.
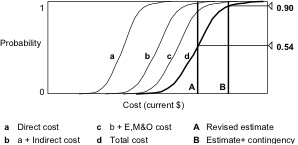
Figure 6 shows the results from the risk analysis. Curves a, b, c and d successively incorporate groups of costs, with curve d representing the total cost distribution for the procurement. The vertical line A shows the dollar value of the most recent cost estimate: the results indicate a 54% chance the procurement can be completed within this amount. Line B shows the estimate including the contingency allowance, indicating a 90% chance of completing the procurement within this budget under normal conditions. (Remember, these results are conditional on catastrophes not arising.) The implication for the project sponsors was that the cost estimate was realistic for planning purposes at this stage of the procurement.
Figure 6: Distributions of procurement cost, showing cost components and projected performance against targets
Extension: incentive contract
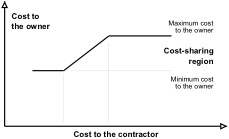
A similar approach was taken to estimating the cost to a sponsor under an open-book incentive contract for a complex, high-technology procurement. Figure 7 shows the structure of the proposed payment approach: above a designated maximum cost, the contractor would bear any over-runs; below a designated minimum, the contractor would keep all profits from innovation and efficient delivery, and costs and savings would be shared according to a designated ratio in the intermediate zone where the actual cost was expected to occur.
An analysis of the risks and their effects on cost variations, in a form similar to that in Figure 6, was combined with the incentive targets and share ratio, to estimate the possible cost to the sponsor. This analysis was undertaken for each submitted tender, to contribute to the tender evaluation and allow a funding submission to be developed and justified.
Figure 7: Cost allocation between owner and contractor in an incentive contract
Quantitative case study: capital evaluation of a new processing plant
This case concerns an assessment of a large capital investment in a minerals processing plant for a major resources company. It differs from the previous cases in that it involved not only capital costs, but also operating costs and revenues through what was expected to be a long life for the new asset. The criteria for decision were the NPV of the investment and its ROR.
The evaluation required a set of linked operational and financial models (Figure 8). The main risk model integrated capital spending, revenue and operating cash flow profiles into a combined cash flow profile for the procurement. These profiles were developed from a variety of supporting models and analyses. In practice, the main model took several different forms, with differing levels of accounting and taxation complexity.
Figure 8: Risk model structure for capital evaluation
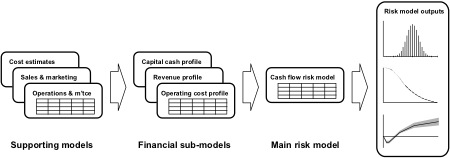
Outputs from the risk model included distributions of the financial criteria (particularly NPV and ROR) and key operational measures (for example, physical production and energy consumption per unit of product). These were generated in the familiar density form, and also as profiles through time where appropriate (Figure 9).
Figure 9: NPV distribution (density histogram form) and risk profile through time
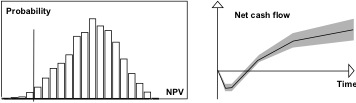
The time-based profile for cash flows illustrated in Figure 9 shows the uncertainty in forecasts increasing further into the future. The central line is the mean outcome forecast by the model; the band on either side is the range in which the outcome is expected with 90% chance. This shows the realistically likely ranges of:
- The maximum working capital requirements, the lowest point of the profile
- The payback period, the range across which the band crosses the time axis
- The closing position at the end of any period in the project’s life.
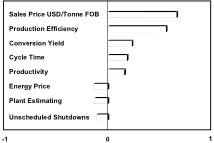
Risk analysis packages like @Risk permit sophisticated sensitivity analyses of the form in Figure 10. This shows the main contributors to NPV, taking into account all the input variations in the risk model. The diagram indicates that the market price of refined product is the most important source of uncertainty in determining the value of the project (something that will not be a surprise to anyone involved with mining), followed by uncertainty in key parameters of the production process itself and the energy price. Capital cost uncertainty, as represented by plant estimating variation, is comparatively minor in comparison.
Figure 10: Sensitivity of NPV to procurement uncertainties (tornado diagram)
Quantitative analyses like the ones outlined above formed an important part of the information provided to the Board for their decision to proceed with the investment.
Extension: selection of strategic options
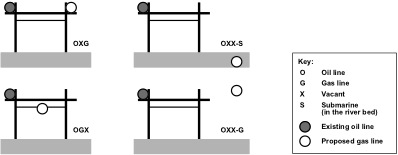
Quantitative analysis was used in the selection of a preferred option for a strategic river crossing [1, 5]. The procurement involved a gas pipeline, the alignment of which was to follow an existing oil pipeline. The oil pipeline crossed a large river on a pipeway cantilevered from a major bridge. Placing the new gas line on the bridge in a vacant pipeway was an obvious solution, but it would increase the risk to the oil and to the bridge itself. Should the new pipe be placed on the bridge, under the bridge (to leave the existing pipeway clear for a potential third pipeline), on a new bridge some distance away, or submerged in a trench in the river bed?
Figure 11: River-crossing options
The analysis was complicated by a number of factors. Like many large procurements, there was a range of stakeholders, and a diverse set of criteria important to each of them. The criteria themselves were not controversial, although estimating them was often difficult, but generating an agreed transformation from ‘natural’ units like barrels of lost oil production to a common numerical scale denominated in dollars raised many issues. For example, the ‘value’ of a barrel of lost oil production can be determined in several ways, depending on whose interests are concerned, as indicated in the table.
Table 6: Stakeholders and measures of the ‘cost’ of lost production
|
Stakeholder |
Appropriate measures |
|---|---|
|
Producer |
Current well-head price per barrel Discounted well-head price (as the production is not lost, only deferred to the end of the life of the oil field) Marginal profitability of a barrel of oil produced |
|
Pipeline operator |
Revenue per barrel transported |
|
Local Government |
Royalty per barrel extracted |
|
Central Government |
Strategic value of energy supplies |
|
Refiner |
Marginal cost of crude from the next-best source |
This was a large and complex analysis, befitting the high-value and high-risk nature of the project. The results were subject to intense scrutiny by the stakeholders involved, as just one input to a wide-ranging decision making process.
Conclusions
Sound risk management plays an important role in achieving effective procurement outcomes, particularly for large scale or complex procurement activities. Risk management involves functions that are common to many aspects of management, a factor that often simplifies their implementation.
Qualitative approaches to risk focus on risk identification and setting priorities, to facilitate better decisions. Such assessments are often simple and fast, enabling quick management responses, but they can also involve very detailed assessments of specific risks if required, generating detailed risk treatment plans and actions.
The scope of quantitative analyses varies with the circumstances, but they are often very sophisticated. They introduce a range of complex and sometimes subtle potential pitfalls, and so they usually require specialist assistance, although they may appear very simple to those providing the data from which they calculate their outputs.
Taken together, qualitative and quantitative analysis provides senior management with a set of practical tools for generating the information on which to base sound procurement decisions, at all stages of the procurement process.
Acknowledgments
My colleagues in Broadleaf Capital International, Dr Stephen Grey, Phil Walker and Geoffrey Raymond, have contributed to a number of the case studies outlined in the paper.
References
Chapman, C.B., D.F. Cooper, C.A. Debelius and A.G. Pecora (1985) 'Problem-solving methodology design on the run', J. Operational Research Society 36(9) 769-778.
Commonwealth of Australia (1992) Department of Administrative Services, 'Commonwealth Procurement Guideline 8: Managing Risk in Procurement’, AGPS, Canberra.
Commonwealth of Australia (1996) ‘Guidelines for Managing Risk in the Australian Public Service’, MAB/MIAC Report 22, AGPS, Canberra.
Cooper, D.F. (1997) Applying Risk Management Techniques to Complex Procurement. Purchasing Australia, Australian Government Publishing Service, Canberra. ISBN 0 642 26803 7.
Cooper, D.F. and C.B. Chapman (1987) 'Risk Analysis for Large Projects: Models, Methods and Cases', John Wiley, Chichester. ISBN 0 471 91247 6.
Cooper, D.F., D.H. Macdonald and C.B. Chapman (1985), 'Risk analysis of a construction cost estimate', International J. Project Management 3(3) 141-149.
Defense Systems Management College (1989), 'Risk Management: Concepts and Guidance', Fort Belvoir, VA, MDA 903-87-C-0781.
Grey, S.J. (1995) ‘Practical Risk Assessment for Project Management’, John Wiley & Sons, Chichester. ISBN 0 471 93979 X.
New South Wales Government (1993) 'Risk Management Guidelines', NSW Public Works Department, Policy Division, Sydney. ISBN 0 7310 2704 3.
Palisade Corporation (1994) ‘@Risk: Risk Analysis and Simulation Add-In for Microsoft Excel or Lotus 1-2-3’, Palisade Corp, Newfield, NY.
Standards Australia and Standards New Zealand (1999) ‘Risk Management’, AS/NZS 4360:1999, Homebush, NSW. ISBN 0 7337 2647 X.