Quantifying risk in business and projects
A version of this article by Dr Stephen Grey, Associate Director, was published originally in The Mining Chronicle, Vol. 2, No. 8, August-September 1997.
Introduction
A recent article on developments and trends in risk management outlined the application of qualitative and quantitative risk assessment techniques. Qualitative or descriptive techniques are useful for identifying the risks requiring management attention, describing them and ranking them according to their significance. Quantitative or numerical risk assessment is a term used to describe two groups of techniques: broadly speaking these are engineering and business oriented applications.
Examples of engineering oriented quantitative risk assessment are specialised hazard and safety studies. The impact of major events such as explosions, fires or unplanned emissions of gas, can be modelled using sophisticated simulation software. These techniques may be described as quantitative risk modelling. However, the term is also applied to a different set of methods not very far removed from conventional business planning and forecasting.
Most readers will be familiar with financial modelling, generally based on spreadsheets. Similar techniques are now available for dealing with uncertainty and the risks flowing from it, using inexpensive add-ins for popular spreadsheet packages. They come into their own particularly when you need a view of the overall risk associated with a project or a business, such as when:
- Setting targets or accepting commitments
- Evaluating the realism of alternative estimates
- Selling a proposal on the basis of confidence in the forecast outcome
- Assessing the return on major investments at pre-feasibility or feasibility stage
- Choosing between alternative investments
- Choosing between alternative technologies with different risk profiles.
Risk modelling
Risk modelling is very similar to conventional project or business forecasting and modelling. You break the overall situation you are concerned with into parts, specify the way the parts go together to make up the outputs you are interested in, and define the individual elements, which might be costs, revenues or durations for instance. You then evaluate the output using the model. Cash flow forecasts, cost estimates and project scheduling tools all work this way.
In a conventional cash flow forecast, the elements are cost and revenue lines, phased over time and described by a specific value for each item in each time period. The relationship between these components and the output measure, NPV, IRR or payback for instance, is mainly ordinary arithmetic.
A cash flow risk model is very much the same, but instead of having a single value for each time period it will have a distribution of values in each time period, as illustrated in the following figure with a variation either side of the base case.
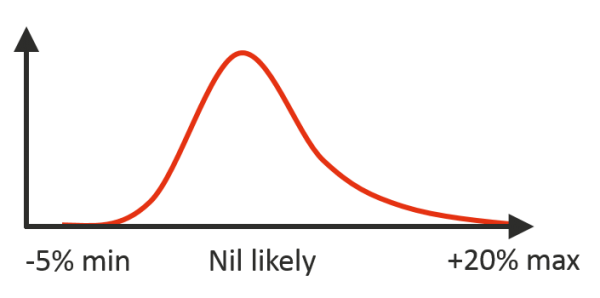
It takes more than simple arithmetic to understand the net effect of several uncertain costs and quantities on an estimate. However, there are spreadsheet based tools which allow you to specify distributions like the one illustrated above, and will evaluate the net effect of the uncertainty they represent on whichever cells in the spreadsheet you define as outputs. One of the most popular and cost-effective tools is Palisade’s add-in for Excel, called @RISK.
What you get from a model
Risk models can tell you a lot about the business or project you are analysing. They can show you:
- The realistically likely range of outcomes to expect
- The risk of exceeding a target as a function of the value of the target
- The relative magnitude of various sources of uncertainty
- The sensitivity of the uncertainty in the output to uncertainty in each input, highlighting the major risk drivers, which might not be what you expected.
The initial output, and the one most people find immediately useful, is the range of likely outcomes, and the risk of exceeding targets in that range. These are generally combined in a graph, a typical example of which is illustrated in the next figure.
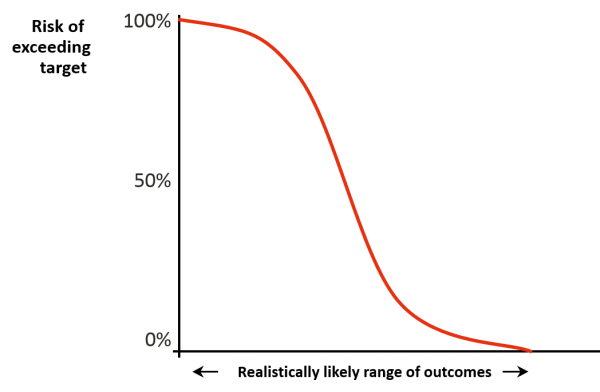
If this graph represented a project’s capital estimate for instance, it would help you judge where to set your own targets, generally towards the right hand end, and how much to release initially to the project budget, usually somewhere nearer the middle. It would also make it clear if earlier expectations had been realistic. Anything falling to the left of the range shown has to seen as very risky for all concerned.
Although the picture above was discussed as if it represented capital costs, it could equally well have been a project’s schedule, or the cost per tonne of processing a mineral.
Time based profiles are slightly different. A time based profile for a cash flow is illustrated in the next figure. This shows that, as we all know, the uncertainty in forecasts tends to increase as they go further out into the future. The central line is the mean outcome forecast by the model. The band on either side is the range in which you can expect to have a 90% chance of finding yourself.
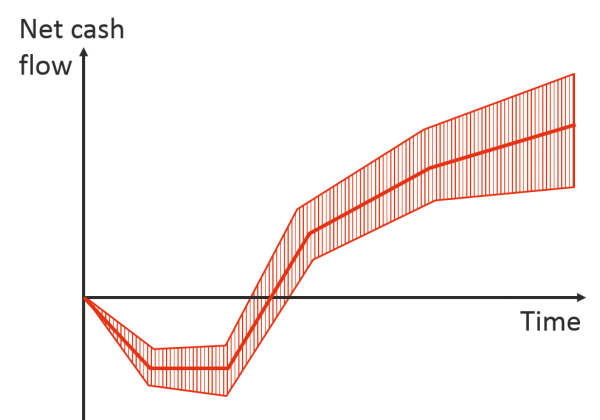
This shows at a glance the realistically likely ranges of:
- The maximum exposure, the bottom of the dip
- The payback period, the range across which the band crosses the time axis
- The closing position at the end of the project’s life.
Who can do this?
The modelling techniques required to carry out these analyses are within the grasp of most competent spreadsheet users familiar with the issues being investigated, and the costs, cash flows, schedules, NPVs, payback periods or other numerical measures of the business or project. The initial work of setting up an analysis, structuring models and determining the nature and scale of the uncertainties, requires some expertise in risk management, but the modelling itself is not unduly difficult. There are pitfalls of course, and as with any form of forecasting, if you put rubbish in you get rubbish out.
The techniques outlined here can never be better than the knowledge which goes into them, so the key inputs generally come from the people already managing the business. However, simple risk models do allow you to make better use of the information you already have. In the first instance they provide a solid framework for describing the risks you face. Their main strength though, lies in drawing together all the uncertainties affecting a business in terms of measures which really matter to you, time, money, headcount, production and so on. Instead of wrestling with a large number of risks and trying to weigh up their net effect by eye, you can model that net effect, evaluate it and examine it as you would with any other model.
Quantitative risk assessment and modelling are described in the book 'Practical Risk Assessment for Project Management', by Stephen Grey and published by John Wiley & Sons in 1995, available through Broadleaf and major bookshops.