Bow tie analysis
Introduction
Bow tie analysis is a simple process for identifying where new or enhanced controls may be worthwhile. It is a core part of risk treatment planning, particularly where there is a high level of risk or where control effectiveness is assessed as low.
Bow tie analysis
Background
A bow tie is a graphical depiction of pathways from the causes of an event or risk to its consequences in a simple qualitative cause-consequence diagram. It is a simplified combination of a fault tree that analyses the cause of an event or risk, the left hand side of the diagram, and an event tree that analyses the consequences, the right hand side. It is represented as a bow tie (Figure 1), where the knot of the bow tie is the point where the fault tree paths converge and the event tree spans out. While bow tie diagrams can be constructed from fault and event trees, they are more often drawn directly from a brainstorming session, providing a fruitful basis for a group exploration of controls.
Figure 1: Bow tie analysis
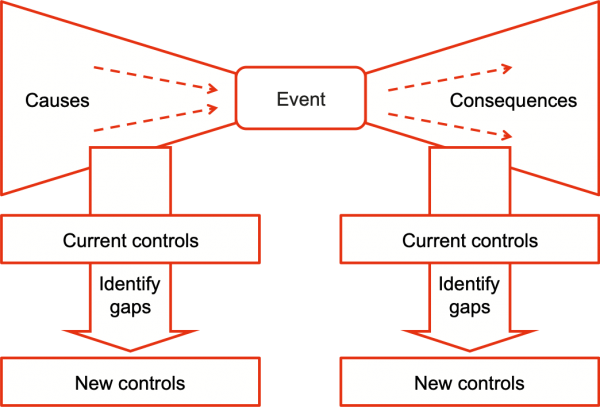
The focus of bow tie analysis is on the barriers or controls depicted to the left-hand side of the knot that can change the likelihood of the event or circumstance, or on those on the right-hand side that can change its consequences. It is used when assessing the completeness of controls, to check that each pathway from cause to event and event to consequence has effective controls, and that factors that could cause controls to fail (including management systems failures) are recognised.
A primary use of bow tie analysis is to identify control gaps, where additional controls may be warranted. Examining causes, consequences and the existing controls that address them helps to identify gaps in the current controls (as shown in Figure 1).
- The most effective controls usually address causes, generally to stop them arising or leading to the risk (preventive controls). They should match the causes, in extent and nature. This requires that the causes and their implications for business objectives be clearly understood, often in some detail. For example, maintenance systems are preventive controls for risks associated with asset integrity.
- On the right of the bow tie, controls should provide appropriate responses to consequences being felt or create barriers to the consequences developing. They might either influence the consequences on business objectives directly (corrective or reactive controls), or detect changes quickly and provide triggers for contingency plans (detective controls). For example, a bund around a storage vessel may not prevent a release of product, but it limits the spread of the release and hence the adverse consequences; a smoke alarm is a detective control that allows fast response to a fire.
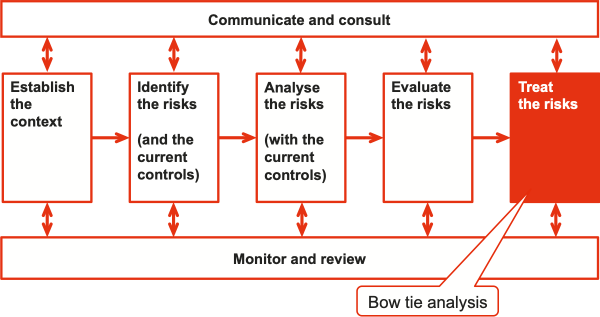
Bow tie analysis is an important contributor to the risk treatment stage of risk management (Figure 2); risk treatment is the stage that enables us to derive benefit from the analysis carried out earlier in the process. Without risk treatment, we do no more than describe the situation in which we are operating.
Figure 2: Bow tie analysis supports risk treatment
A bow tie can also be used for recording information about a risk that does not fit the simple linear representation of a risk register. It can be used proactively to consider potential events and scenarios (risks) and retrospectively to model events that have already occurred (see our tutorial on learning lessons here).
The logical flow of a bow tie diagram also provides a very effective means of illustrating the factors at work in relation to a major risk. This makes it useful for communicating with people outside the immediate group carrying out the analysis.
Simple bow tie analysis
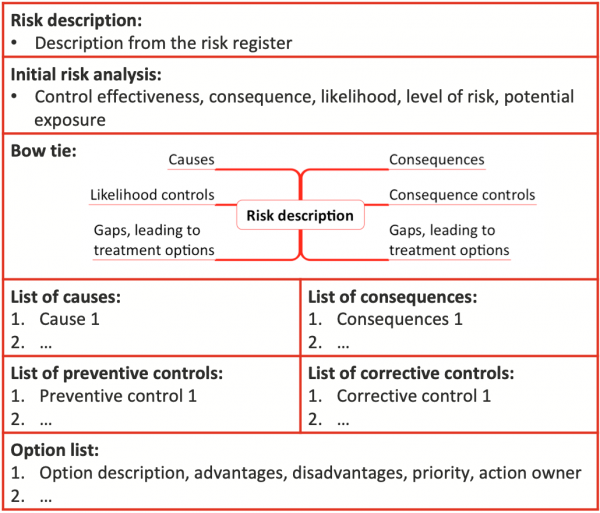
Simple bow tie analysis can be conducted using straightforward templates like the one in Figure 3.
- Identify the risk to be examined in the bow tie analysis. Bow tie analysis is of most use for risks that have high levels of risk, and particularly those with high consequences.
- Describe the risk, in the form [something happens] and leads to [a consequence for our objectives], and note the main risk analysis outcomes from the risk register.
- List the causes of the risk on the left and the consequences of the risk on the right, drawing on material from the risk register and expanding where possible.
- List the existing controls on the causes (preventive controls) below the causes on the left, and the controls on the consequences (corrective controls) below the consequences on the right. If a control acts on both causes and consequences, then show it twice, on each side of the template.
- Assess the effectiveness of each control, by asking ‘Is it designed well (could it work)?’ and ‘Is it implemented well (does it work)?’
- Identify options for enhancing existing controls, to improve their effectiveness or to fill gaps. This may include enhanced monitoring and more frequent review, for example using control self-assessment.
- Look for gaps, where there are causes and consequences for which there are no matching controls.
- Identify options for creating new controls to fill the gaps.
- Evaluate the advantages and disadvantages of each option, agree options to be pursued, and develop implementation plans.
Figure 3: Bow tie analysis template
In most circumstances, actions to create new or revised controls will be implemented only if they generate a net benefit for the organisation, where the advantages and benefits outweigh the disadvantages and costs when considered as a whole. However, controls should conform to relevant standards or regulatory requirements, such as those imposed by workplace health and safety policy or legislation. In circumstances like this the net benefit criterion may not apply, and implementation must proceed, irrespective of net benefit, to satisfy compliance obligations. Benefits and costs should be interpreted more broadly than simple financial measures.
More complex bow ties
If necessary, bow tie diagrams can be drawn showing the mechanisms that cause a risk, and the mechanisms that lead to consequences (Figure 4). Controls can be shown as barriers on the pathways from causes to the risk and on to the consequences, or barriers to escalation. Some controls may act as barriers on several pathways.
Figure 4: Detailed bow tie
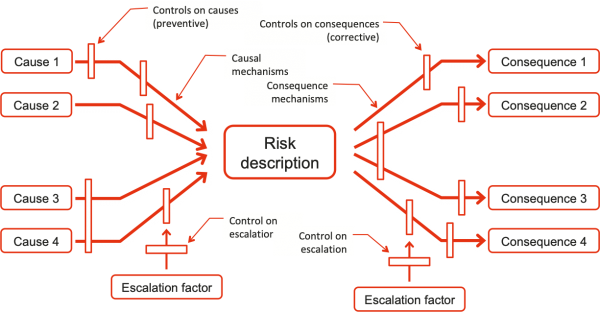
Management functions that support specific controls can also be shown, linked to the associated controls. Where necessary, bow ties can be linked, so that consequences from one bow tie become the causes in another.
However, more detailed bow ties like the one in Figure 4 should only be used where there is value in doing so. In many circumstances a simple approach supported by templates like the one in Figure 3 will be quite sufficient.
Uses of bow tie analysis
Bow tie analysis is of most use in the following situations:
- A simple diagram is required to communicate the range of causes and consequences and the associated controls
- More detail about the causes and consequences of a risk is needed than is contained in a risk register
- Where a graphical representation may be much clearer than text
- There are clear pathways from causes to the risk, and from the risk to the consequences
- The overall level of control effectiveness is believed to be low
- The focus is on identifying controls, control effectiveness and control gaps and ensuring that each pathway has a control (a barrier)
- The situation is more complex than a single cause-event-consequence pathway, but not so complex that a full fault tree analysis and event tree analysis is warranted.
Bow tie analysis can be used for desirable influences as well as those we seek to avoid. In this case the controls are not barriers, but rather factors that support or enhance the pathways.
Bow tie analysis is not useful when:
- There are multiple causes that are linked in complex ways, for example when there might be AND and OR gates in a fault tree depicting the left-hand side of the bow tie
- Where detailed quantification is needed.
A note on quantifying bow ties
Some level of quantification of a bow tie diagram can be possible where:
- The pathways are independent
- The probabilities of events on each pathway can be estimated
- The probabilities that particular controls will fail can be estimated.
However, many situations are more complex, pathways and barriers are not independent, and the effectiveness of the controls may be uncertain. It is unwise to attempt quantification in these circumstances. More appropriate quantification tools may be fault tree analysis, event tree analysis or level of protection analysis.
Software for bow tie analysis
Simple bow tie analysis can be conducted using templates like the one in Figure 3 that are straightforward tables in Microsoft Word.
If more complex bow ties like Figure 4 are needed, then specific software may be useful. There are several proprietary packages in general use.
Improving controls
Bow tie analysis indicates where new or enhanced controls may be needed. Table 1 provides a summary guide to the six steps involved in detailed control design and implementation. (A tutorial note on control design is available here.)
|
Step |
Topics |
|---|---|
|
Bow tie analysis showing causes, consequences and existing controls Sources of risk Control gaps |
|
|
Extent and scope of controls that are needed to address related risks Ability of the control to be checked |
|
|
Options to change the likelihood of the event and its consequences Options to change the consequences Options for addressing shared risks Control in depth |
|
|
Advantages and benefits compared with disadvantages and costs |
|
|
Task definition and purpose Task allocation and timing Communication, particularly between risk owners and control owners |
|
|
Monitoring the timely and effective completion of improvement tasks Monitoring the continuing effectiveness of the control How and when monitoring will be conducted and recorded |
After a new control is implemented
When a new control has been implemented, or an existing control has been modified, the risk management information system should be updated. Ideally, the information system should contain a description of the control and what it is supposed to do (its design intent), as well as details of associated checking processes, whether monitoring, review or both:
- How it should be checked
- When it should be checked
- Who is responsible for making sure that checking takes place (the control owner).
The new or revised controls should be monitored under realistic operational conditions, and reviewed periodically, to confirm they are implemented well and working as intended.