Pre-bid risks for a large construction contract
Summary
This case shows how qualitative and quantitative assessments of commercial and project uncertainty were used when preparing a response to a large, complex request for tender (RFT). The aim was to assist the bidders to understand the risks they would face and the implications for their businesses if their tender were accepted, and to develop a realistic view of the budget they would need, including an appropriate contingency. This helped them to develop a negotiating strategy, and to set a bid price that would be low enough to be competitive yet high enough to be commercially attractive if they were successful.
Background
The project
This case concerns work that was part of a multi-billion dollar project located on a green-field offshore site. The project owner was a consortium of international oil companies. A consortium of international engineering companies was its engineering, procurement and construction management (EPCM) contractor.
Broadleaf’s client was a joint venture (JV) involving several large construction companies. The JV planned to submit a tender to provide fabrication and construction services for a section of the project. The tendered work formed only a small proportion of the total cost of the project, but nevertheless its scale was substantial for all the JV partners.
As well as complex engineering, there were strict requirements on environmental protection, quarantine and safety of personnel.
Requirement
The focus of our work was on risks the JV would face if it were successful in winning the tender. Figure 1 shows some of the organisational and risk relationships involved.
Figure 1: Organisational and risk structure
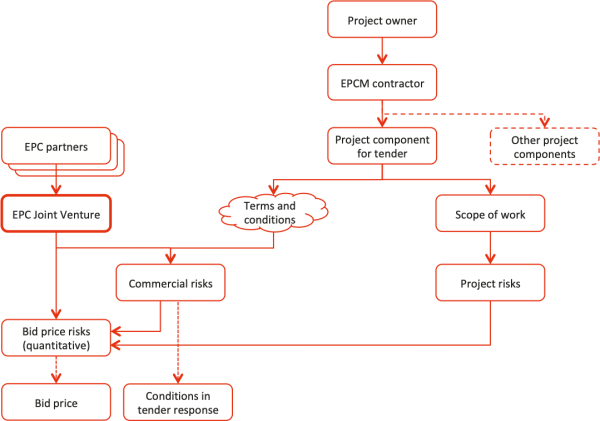
A lack of clarity in the EPCM’s RFT documents for the work the JV proposed to address added to the usual complexity of tender preparation, exacerbated in this case by the scale of the opportunity in relation to the JV partners' existing activities. If they won the work, it would form a large part of their business. The risk assessments took place in the context of an evolving commercial approach to the tender and before many of the technical responses were settled.
The objective was to assist the JV partners to develop a comprehensive understanding of the uncertainties they would face if their tender were accepted, including the implications for their businesses of winning this work. In addition, the partners wanted a realistic view of the budget they would need, including contingency, to balance the requirements of their bid to be low enough to be competitive yet high enough to be commercially attractive for the JV.
The JV partners required:
- The efficiency of a qualitative risk assessment to expose the sources of uncertainty they would face and to identify management priorities, both for immediate action as well as for implementation planning
- The insight provided by a quantitative cost risk analysis to enable them to understand fully the trade off between competitive pricing and risk to the businesses of the JV partners.
Approach
The qualitative assessment was based on what might happen were the JV to win the bid and implement the project. It addressed two aspects of the bid:
- Commercial risks, arising from the terms and conditions contained in the RFT and from the interfaces between the project, the JV and the JV partners' businesses
- Project risks arising in the delivery of the project.
The quantitative analysis focussed on the non-reimbursable components of the project cost where the JV would be exposed to uncertainty.
The risk assessment was not concerned with the likelihood of winning or losing the bid. It was framed in terms of the JV’s bid having been successful.
Qualitative risk assessment
Overview
The risk management process was aligned with ISO 31000. The detailed process was based on a process used by one of the JV companies, which was tailored for the project and agreed by all the partners.
Context setting
The scale of this project, the implications for the JV partners' businesses, and the risks associated with the project and with the operation of the JV itself, were clearly significant. This meant that the initial context-setting step would require close attention. Working with the JV management team, we explored the context of the project implementation carefully, as well as the relationship between the JV entity and the partners' businesses and the business implications of winning the work.
We identified over 20 major stakeholders and discussed their objectives and motivations. We discussed the main factors in the external and internal environment, with their implications for the JV and the project.
We developed a set of key elements to provide a structure for the risk assessment. The key elements were used as the agenda for the workshops. All members of the JV team were very busy in this phase of the tender, so it was important to use their time efficiently. The agenda allowed them to participate where they could make the most useful contributions, but otherwise attend to other critical work. The management team participated throughout.
Initial risk identification activities
Several risk identification activities had been undertaken before the risk assessment described here:
- A preliminary hazard identification had been performed
- The JV’s commercial team had examined the request for tender documents, the terms and conditions and the draft contract to identify associated risks and their implications for the JV partners.
We conducted detailed interviews with senior members of the JV team, including all discipline team leaders. Combining these with the earlier analyses, we developed an initial risk register for the workshops.
Risk assessment process
The initial risk register was reviewed and augmented with additional entries in two days of workshops that specialist groups attended for an hour or two at a time. Duplicated risks were eliminated and further entries were made where appropriate.
For each risk, the workshops generated:
- A description of the risk, its causes and its consequences
- A summary of the existing controls, taking into account those that were actually in place (for example, plans prepared and data gathered for the tender) and those that required no further action to ensure they would be in place at the time of project implementation (for example, mandatory corporate safety processes)
- An assessment of the effectiveness of the existing controls
- Ratings for the consequences, linked to the JV objectives, and for the likelihood of those consequences arising
- The level of risk associated with the assigned consequence and likelihood ratings
- The potential exposure, the greatest consequences that might arise were all the controls to fail, linked to the consequence scale.
The rating scales were tailored for this project and the JV. They all included detailed descriptions to ensure clarity and consistency.
Risk assessment outcomes
The distribution of risks among the consequence and likelihood scores assigned in the workshops and subsequent revisions is summarised in Table 1.
Table 1: Distribution of ratings
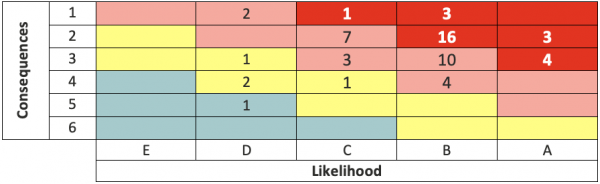
There was a preponderance of risks in the top two categories, for two reasons:
- Participants in the assessment focused their attention on the most severe risks, as is usual in time-constrained circumstances like this
- The commercial terms, as well as some aspects of the scope and technical requirement, were unclear to some participants, there were differences of opinion among the team and there was a sense that the project owner was dictating onerous terms that could not be challenged, all contributing to greater uncertainty and hence higher levels of risk.
The split of risks by topic and rating is shown in Table 2. The numbers of risks in an area was not necessarily a measure of the threat it represented to the project, but it did show where the workshop participants' concerns were most active. For example, construction and project controls were both challenging areas of work, and their risk counts were boosted by a number of specific concerns about quality that included more detail than in other areas. On the other hand, quarantine was a matter of great concern but it was possible to capture quarantine-related uncertainty concisely in two summary risk statements.
|
Element |
Very high |
High |
Medium |
Low |
|---|---|---|---|---|
|
Construction |
10 |
3 |
||
|
Project controls |
4 |
7 |
3 |
|
|
People and industrial relations |
4 |
2 |
||
|
Commercial |
3 |
4 |
||
|
Logistics |
3 |
1 |
||
|
Business |
2 |
1 |
1 |
|
|
Commissioning |
1 |
1 |
||
|
Environment |
3 |
|||
|
Estimating |
3 |
|||
|
Quarantine |
2 |
Perhaps more instructive than the bald priority ratings derived from the assessment was the insight it provided into the links between risks and the many complex and interacting relationships that would drive the project. Most were common to all major construction projects, but none of the JV partners had encountered previously anything of the intensity and scale presented by this project.
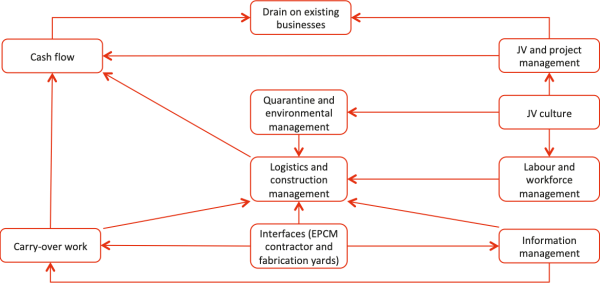
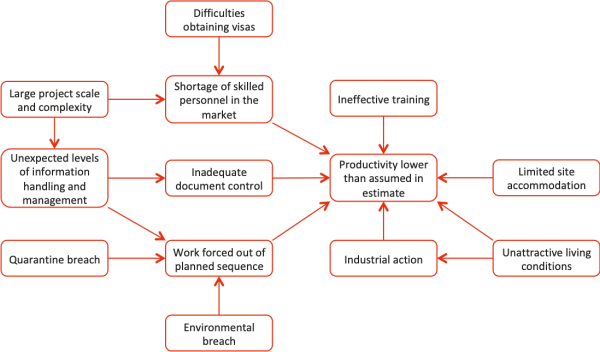
A cluster analysis of the relationships between causes, risks and consequences in the risk register was used to identify natural groupings within the risks. An extract of the most closely linked factors, the factors that affect five or more others, is shown graphically in Figure 2. As with a simple count of the risks in each topic in Table 2, this extract is just one insight into the forces at work. A far more detailed version of this diagram was also prepared, showing the other factors linked directly to these influential components, to indicate the scale and level of interactions among the risks affecting project implementation.
Figure 2: Factors influencing other risks
The outcomes of the qualitative risk assessment were used to understand the sources of risk that the project would face and their interactions. From this, the senior JV managers determined a priority order for attention to the risks:
- First, those risks that were unacceptably high and required immediate action
- Second, those risks that were not critical for the tender, but would require close attention during implementation
- Third, those risks that could be managed with existing controls and procedures.
Although treatment options were not a focus of the risk assessment workshops, many suggested actions were raised and these were noted and recorded for the project team to review later.
Quantitative estimate of cost contingency
Overview
There was intense interest in establishing how much contingency would be required to provide the JV with confidence that its commercial offer would form a viable basis for implementing the work if the tender were won. The qualitative assessment provided an important foundation for this.
A quantitative model was produced in Excel using the @RISK add-in and evaluated by Monte Carlo simulation. It covered all the main sources of uncertainty that were allocated to the JV in the tender terms, including uncertainties in quantities, rates, productivities and the schedule.
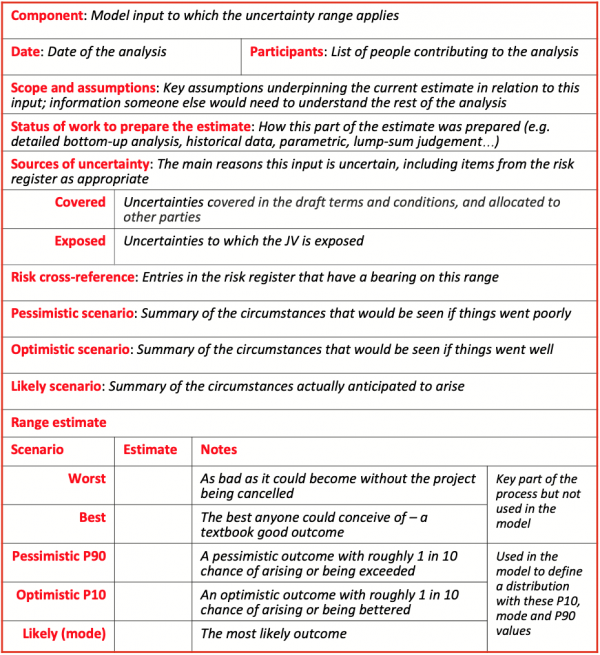
Range estimate inputs
Inputs to the model were developed in range analysis workshops with the JV estimating team. We usually use a simple template for this, but with one important adjustment for this case (Table 3): when sources of uncertainty were identified and recorded, they were grouped into:
- Uncertainties that were covered in the draft terms and conditions and allocated to other parties
- Uncertainties to which the JV was exposed and for which it would bear the financial consequences.
Table 3: Range analysis template
Model outputs
The outputs of the cost model focussed on those aspects of the costs that would have a variable impact on the JV partners. The values shown in the graphs below relate only to the risks and the variation they would cause from the base forecast of cost. The effects of the risks have been normalised to $100 million; the reimbursable components of the costs have been excluded. They are presented in terms of:
- A distribution of costs, showing the chance of exceeding values in the realistically likely range of outcomes for those risks that were included in the estimate (Figure 3)
- An analysis of which components of the estimate contributed most to the gap between the model forecast and the base estimate (Figure 4)
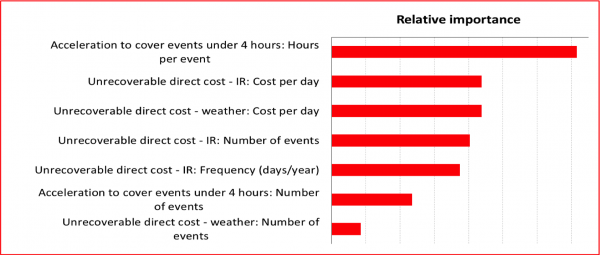
- An analysis of which sources of uncertainty make the greatest contribution to the spread of possible costs, that is to the uncertainty in the total cost (Figure 5); this includes uncertainties associated with the occurrence of events, likelihood, and with the consequences of those events, impact.
Figure 3: Total cost of included risks
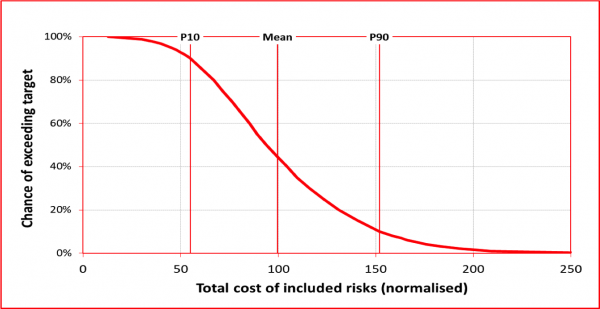
Figure 4: Components of contingency
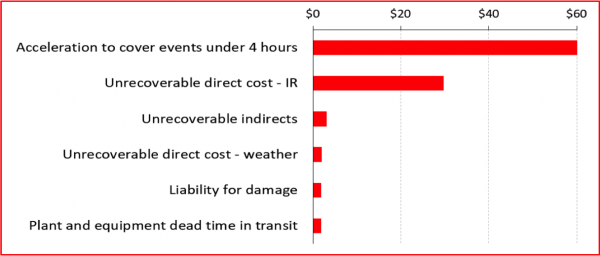
Figure 5: Sources of uncertainty
This quantitative information was valuable for establishing an initial budget and contingency amount. It also helped to identify where the estimate might benefit from additional technical attention to reduce uncertainty and hence reduce the contingency, and where the JV might reduce its exposure by adopting commercial terms that changed the allocation of risk.
Developing the tender response
Broadleaf was not involved in developing the detailed tender response, nor in setting the bid price. Going beyond our work for the JV, we have included short notes here to show one approach to using the outcomes from modelling activities like those above in the commercial decision-making process.
When a company makes a bid B, it makes a profit of B – C if it wins the tender, where C is the estimated cost of delivering the project, and a profit of zero if it loses. In general, it wants to maximise the expected value E(.) of its profit. This can be expressed as:
E(B|C) = (B – C) * p(B|C)
where p(B|C) is the probability of winning the tender with a bid B and cost estimate C.
In this case study, the estimated cost C for the JV was calculated as the distribution in Figure 3. The challenge then is to estimate p(B|C).
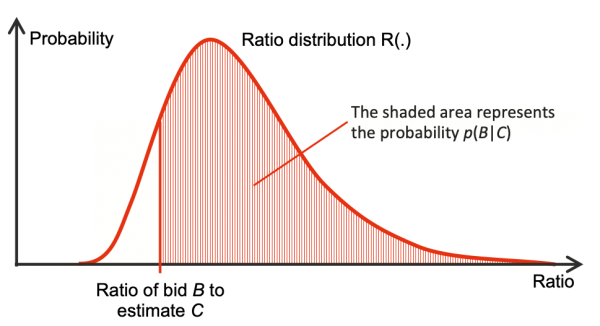
Some organisations keep track of their bidding history: the values of B and C for historical tenders in which they have participated; whether or not they won those tenders; and the value of the winning bid if they lost. From this they are able to estimate a distribution R(.) of the ratio of the best competitor’s bid to their own cost estimate. (Using the ratio normalises the data to the project size.) The chance of winning the bid p(B|C) is then the shaded area under the distribution curve for R in Figure 6.
Figure 6: Chance of winning the bid
If C and R are both known, then an optimal value of B can be selected to maximise E(B|C).
This is a simplification of what actually happens in practice. While C can be estimated as a distribution like Figure 3, estimating the chance of winning the bid p(B|C) to allow a sensible and justifiable trade-off when selecting the bid amount B is far more difficult:
- Obtaining and recording appropriate data may be difficult or impossible, as winning bids are not made public for all tenders
- Making a sound estimate of R may not be possible, as the ratio of winning bid to estimated cost may only be stable in limited circumstances, such as for tenders in a specific range of size or complexity, in particular sectors, or for tenders where there are many bidders
- For large projects with individual characteristics and idiosyncrasies, and possibly with only a few large bidders, there may be no comparable historical data on which to draw
- There may be other important market and commercial intelligence that must be taken into account.
For more information about competitive bidding, and additional references, see Chapter 28 of Chapman et al (1987).
Lessons
Benefits in tender preparation
Preparing a tender response to a large and complex RFT, often in a short period, is a significant project in its own right. As in any project, risk assessments, whether qualitative or quantitative, assist the bid manager and the bidding team in many ways:
- The assessments help to identify areas of uncertainty that must be addressed in tender response documents, and hence help managers to allocate scarce resources and effort
- Examining risks that are amenable to engineering solutions allows the costs of additional engineering, technical analysis or other project effort to be included in refined cost estimates
- Examining risks that are amenable to commercial solutions informs commercial responses and negotiating strategies, as well as contingency amounts to include in the bid price if negotiations are not successful.
Cluster analysis and influence diagrams
Where there are complex interactions between technical and commercial matters, influence diagrams like Figure 2 can be important aids to understanding and communication. The larger version of Figure 2, with its wider net of relationships, was particularly useful for the commercial team as they examined the terms and conditions in detail. The larger version used colour coding to highlight closely related aspects and show the ‘bigger picture’ as well as the detail.
We also used an earlier, simplified influence diagram to provide insight in the qualitative risk assessments, particularly for risk identification.
Communication within the JV team
The outcome from this work included tangible deliverables, such as reports, risk registers and agreed risk treatment task lists, and intangible benefits within the project team. The team members each broadened their understanding of the project and collectively increased the level of consensus among them through participation in the exercise.
The risk assessment process exposed misunderstandings and unstated assumptions, some of which were resolved easily as they were captured early in the development of the bid. The data sheets generated in the quantitative workshops also documented critical uncertainties affecting the cost and increased understanding among the JV team.
This increase in understanding and insight into core assumptions and critical uncertainties across an undertaking is a common beneficial outcome of workshops and activities of the kind conducted here.
In addition, the tangible deliverables such as the registers, worksheets and influence diagrams provided a base for updating the assessments and analyses as bid preparation proceeded, new information became available and circumstances changed.
Reference
Chapman, CB, DF Cooper and MJ Page (1987) Management for Engineers. John Wiley & Sons, Chichester.
- Client:
- Consortium of construction companies
- Sector:
- Oil and gas
- Services included:
- Project risk management
- Quantitative modelling
- Cost uncertainty
- Contract support