Cost uncertainty in a cable-laying contract
Summary
This case study describes a quantitative risk analysis undertaken with a construction company that was preparing a bid to design and construct fibre optic broadband infrastructure in a regional area. The purpose of the analysis was to understand the uncertainty in the initial cost estimate for the activity, and to contribute to the company’s decisions about whether to bid and at what price.
The case demonstrates the role of quantitative analysis of uncertainty as part of a contractor’s bid development process.
Background
The project
The infrastructure to be created was a backbone optical fibre connection to support high-volume communications between nominated starting and completion points that were a long distance apart. Multiple spurs would connect the main fibre infrastructure with existing and proposed communication exchanges, network nodes and regional distribution points.
While the locations of termination points and most intermediate connection points had been decided, a suitable route between these points had not been established. As a consequence, the specific location of the fibre, detailed construction requirements and the requirements of local authorities along the route had not been determined.
The infrastructure owner had initiated a tender process to select a design and construct contractor to undertake the work. Our client was considering tendering for the work.
Addressing uncertainty in the bid process
Over several years, the contractor had evolved an approach to its commercial activities that was explicitly risk-based. Its tender assessment and bidding processes involved a series of formal stages, with decisions made by senior managers about whether or not to invest further effort and move to the next part of the process.
The decisions at the end of each stage took account of:
- The ‘fit’ between the proposed work and the company’s strategic direction
- The commercial benefits to the company if its bid were successful
- The risks to which the company might be exposed if it undertook the work.
Both qualitative and quantitative approaches to risk and uncertainty were mandated at various stages of the bid process.
Initial qualitative risk assessment
At an early stage of developing its tender response, before the quantitative analysis that is the main subject of this case study, the contractor had conducted a qualitative risk assessment for the bid, using its established risk management processes. This assessment examined the topics in Table 1, to identify and analyse risks in qualitative terms and agree priorities for addressing the most significant sources of uncertainty.
|
Element |
Topics covered |
|---|---|
|
Logistics and resources |
Human resources: sufficient, suitability productivity, training requirements Sub-contractors: suitability, availability Materials: price, delivery, storage Suppliers: price, continuity, reliability Plant and equipment Safety, environmental and traffic management, internal contract management, other systems, stakeholder and regulatory requirements (e.g. permits to work), relationships |
|
Remote location |
Distance from senior management oversight, communications, accommodation facilities, indigenous issues, weather, environment, landowners, access to sites |
|
Design and construction |
Route survey and selection, client requirements, preconstruction, construction activities, reinstatement works, program, duration, commissioning |
|
Commercial |
Warranties, performance, subcontracts, supplier agreements, regulatory matters, contract terms and conditions |
The initial assessment confirmed that there were few technical or commercial risks of concern. It also confirmed senior management’s view that this project would be well within the capability of the company, and within its risk appetite. This, and the scale of the activity, supported the decision to move to subsequent stages of tender development and to undertake a quantitative analysis of the uncertainty associated with the company’s bid.
Quantitative risk analysis
Model structure
Following the qualitative assessment, we worked with the contractor’s bid team to examine the tender estimate. We developed an agreed quantitative risk model structure, based on a high-level summary of the cost estimate used for the tender submission and taking into account the outcomes from the initial qualitative risk assessment. It included the most important quantity and rate uncertainties in the estimate, and the main dependencies or relationships between them.
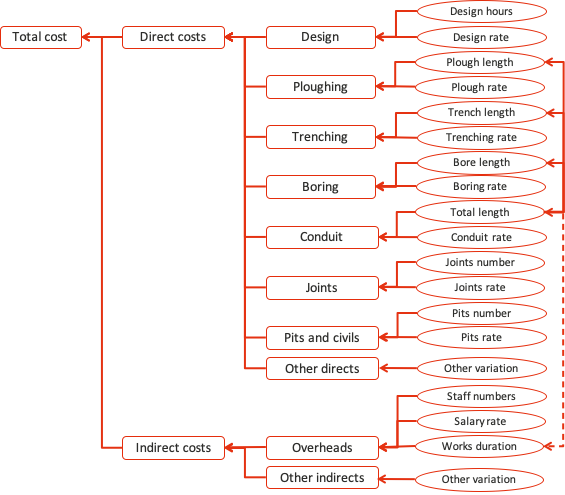
The risk model structure is illustrated in Figure 1. The boxes represent uncertain costs, with the ovals representing the sources of variation for each of them. Each variation was modelled as a distribution, defined by an optimistic, most likely and pessimistic view of the variation from the base estimate.
Figure 1: Risk model structure
Some of the distributions used in the model and the way they were applied to the estimate are outlined in Table 2. The model was implemented in Excel with @RISK.
|
Item |
Role in quantitative model |
|---|---|
|
Design |
Hours and rate uncertainties applied directly to the corresponding cost as multipliers Simulated cost = Base estimate x (100%+Percentage variation in design hours) x (100%+Percentage variation in design rate) |
|
Trenching |
Length and rate uncertainties applied to the corresponding cost as multipliers, with length adjustments Trench length = Simulated total length x Trench-to-bore ratio Simulated cost = Base estimate x (100%+Percentage variation in trench length) x (100%+Percentage variation in trenching rate) |
|
Boring |
Length and rate uncertainties applied directly to the corresponding cost as multipliers Bore length = Simulated total length – Simulated trench length Simulated cost = Base estimate x (100%+Percentage variation in bore length) x (100%+Percentage variation in boring rate) |
|
Pits |
Quantity and rate uncertainties applied directly to the corresponding cost as multipliers Simulated cost = Base estimate x (100%+Percentage variation in number of pits) x (100%+Percentage variation in pits rate) |
Uncertainty inputs to the quantitative model
We facilitated a workshop with key members of the bid team to discuss sources of uncertainty in the costs and cost drivers and to define the distributions in the risk model. We used data tables like the one in Table 3 to record the context and the main assumptions that provide the basis for the ranges assigned.
The worst-case and best-case values that appear in the template were not used in the model; they serve to avoid complacency and settling on a range that is narrower than might be seen in reality, reducing anchoring bias. The sequence of pessimistic followed by optimistic followed by likely estimates was also used to reduce anchoring and adjustment bias.
Table 3: Data table template
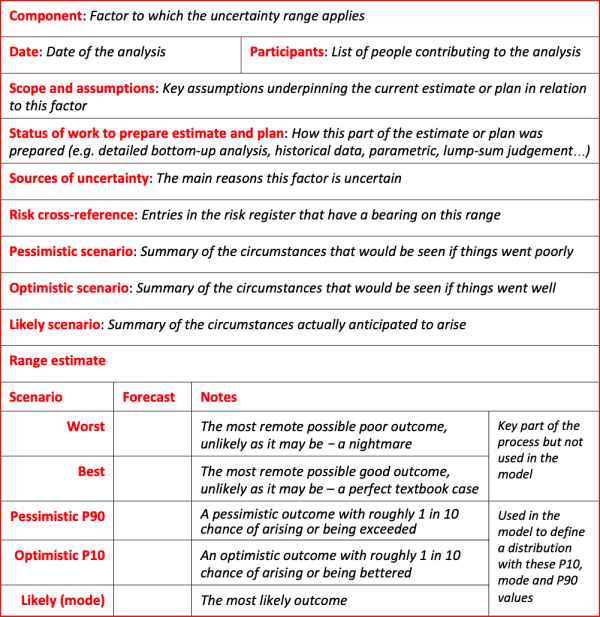
The optimistic, likely and pessimistic values were used to define the distributions in the model. The optimistic and pessimistic values were intended to be estimates of values that had about a 10% chance of being exceeded.
Correlation
It is essential that correlation be included appropriately in risk models. Failure to take proper account of the relationships between variables is one of the most common pitfalls when building quantitative models of uncertainty. Omitting important correlations can lead to a significant reduction in the spread of the outcome distribution, corresponding to a significant under-estimation of risk. Careful model design can give effect to this correlation in a straightforward and realistic fashion.
In this case, most of the factors in the model were either independent of one another, or the relationships between them were embedded in the structure of the model. For example:
- Design activities and construction tasks, and their associated quantity and rate variations, are clearly independent, as they involve different teams at different times
- A single distribution representing labour rate uncertainty (not shown in Figure 1) was used in all construction items, representing the fact that variations in labour rate agreements tend to spread through a project.
- The complex relationships between the lengths of various forms of construction along the cable route were included in the detailed model calculations.
An explicit correlation was included, using @RISK’s modelling capability, between the distributions representing the rate variations for civil materials for pit and conduit construction, as they were derived from the same source materials and suppliers, although in practice this had no material effect on the overall cost variability.
Outcomes
The range of possible cost outcomes and the chance of exceeding specific costs within that range is shown in Figure 2. The curve shows the chance, on the vertical axis, of a cost arising that exceeds a value on the horizontal axis. Costs have been normalised so the total, including direct, indirect and overhead costs, and the contractor’s usual margin, sums to 100, to avoid disclosing client information.
Figure 2: Cost distribution
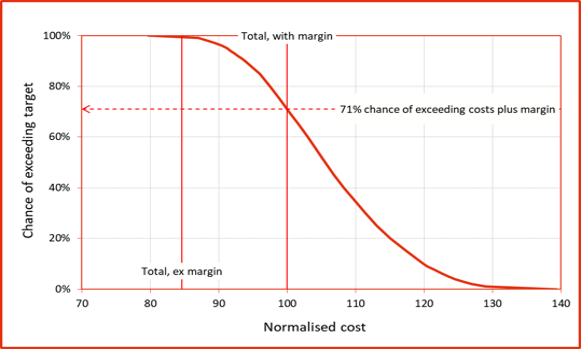
The diagram shows that:
- The actual costs will almost certainly exceed the contractor’s current estimate of its direct, indirect and overhead costs
- There is more than a 70% chance that the actual costs will exceed the current estimate of costs plus the contractor’s usual margin
- The contractor would need to increase its bid by 20% above its costs plus margin, i.e. to 120 on a normalised basis, to reduce the chance of over-running to about 1 in 10.
Sensitivity analysis
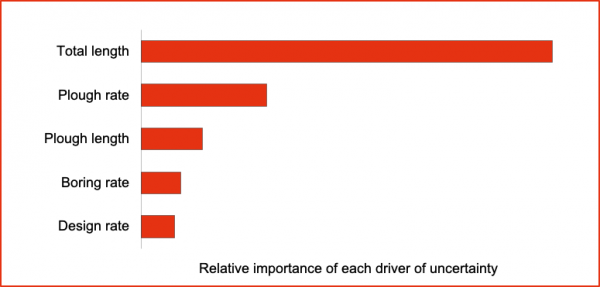
The quantitative analysis provided a clear guide to where the contractor needed to work on its bid in terms of technical, engineering, estimating and commercial effort. The sensitivity analysis shown in Figure 3 provided further guidance about the factors that made the greatest contribution to the uncertainty in the cost, those factors that contributed most to the spread of the curve in Figure 2.
Unsurprisingly, the uncertainty in the total route length was the strongest contributor to uncertainty in the cost. As indicated in Figure 1, length uncertainty affected the relative lengths of the ploughing, trenching, boring and conduit, as well as the amount of overheads. The uncertainty associated with the plough rate per kilometre was also important.
The other factors in the model made markedly smaller contributors to the overall cost uncertainty than those shown in the diagram.
Figure 3: Drivers of uncertainty
Lessons
Staged tender evaluation process
Most contractors are very prudent about taking risks. They generally operate on slim margins and do not have large balance sheets, so they are unwilling to bid where there is a chance they might not achieve their target profit, or in the extreme, lose significant money. They have low appetites for risk.
Like the contractor in this case, most successful contracting companies use a staged decision-making process when making decisions about prospective tender bids, in which information from one part of the process is used to inform the stages that follow. While the details of the processes vary widely between contractors and the kinds and scales of work they undertake, they often incorporate the three main focus areas summarised in Table 4.
|
Focus |
Topics |
|---|---|
|
Strategic analysis |
High-level analysis of how closely the work aligns with the company’s strategic direction |
|
Qualitative risk assessment |
Identify ‘deal breakers’ and fatal flaws Assess potential competitors and the prospects of a successful bid Then identify risks that would need to be addressed in the bid, either technically or commercially |
|
Quantitative analysis of uncertainty |
Identify the range of commercial outcomes that might arise Identify the main sources of uncertainty in the outcomes, to focus technical and engineering effort on reducing the uncertainty, or commercial effort on negotiating commercial terms that would allow the associated risk to be shared appropriately with other parties Set a bid price that balances commercial considerations against the company’s appetite for risk |
This is analogous to the stage-gate processes that project owners use to approve large capital investments and projects. Whether an owner or a contractor, following a disciplined approach to making decisions reduces the chances of making costly mistakes and ensures that the additional effort involved in each step of the process is only expended on prospects that have some chance of success.
Selection of target cost and contingency
The kind of quantitative analysis used in this case provided a good indication of the range of outcomes that might arise and the relative likelihood of values within that range. It also provided a rationale for the conclusions in the form of the data tables, the relationships embodied in the model and the parameters it used. Subjective judgements cannot be eliminated from this or any forecasting process, but here the key points of those judgements were documented and used in a transparent manner that could be reviewed and challenged.
While the output of the quantitative cost risk model provided a useful guide for the decision makers about contingency and price setting, it had to be set against:
- The commercial pressure to minimise the price
- The degree of control the company would be able to exercise if performance started to drift away from the plan
- Factors that might make the job more or less attractive aside from its financial performance, such as its implications for future work or the effect on a competitor’s business.
The analysis also indicated the key drivers of the uncertainty. This knowledge was used in two ways:
- To focus the attention of estimators on the most sensitive parts of the estimate
- To guide negotiations about the allocation of risks in the contract to the most appropriate party.
There are no hard and fast rules about the level of risk at which a cost target, including contingency, should be set. Where these techniques are used regularly over an extended period, managers will start to develop an understanding of the relationship between the uncertainty exposed by the analysis and the difficulty of executing the works.
- Client:
- Engineering construction contractor
- Sector:
- Information and communications technology
- Services included:
- Quantitative modelling
- Cost uncertainty
- Contract support