Bridge operations on a commuter road
Summary
This case study outlines a risk assessment and the development of treatment options for enhancing the reliability of an opening bridge on a commuter road. Failure modes and effects analysis (FMEA) was used to augment aspects of the risk assessment. The case discusses the importance of site familiarisation, setting workshop agendas carefully, adapting the risk management process to enhance its effectiveness, using a flexible approach to setting priorities for management attention, and the value of templates for efficiency, effectiveness and due diligence.
Introduction
Background
This case study concerns a bridge on a busy commuter road (Figure 1). The bridge crosses the entrance to a tidal lake. It is a bascule bridge with spans that open vertically to allow commercial and recreational vessels to pass.
Figure 1: Indicative bridge layout
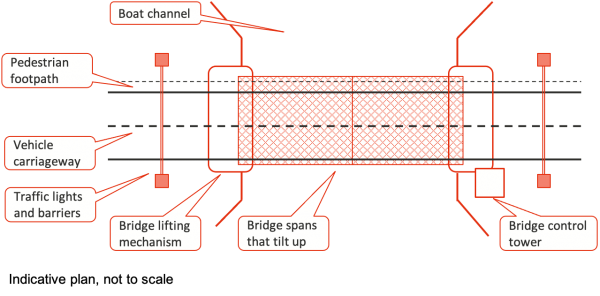
The bridge is many decades old, and the volume of traffic it services has grown since it was constructed. Despite regular maintenance and significant technical work and refits, the lifting mechanisms were not as reliable as desired. There had been some high-profile failures, resulting in major interruptions in the flow of commuter traffic, disruption to marine activities, widespread media attention and political embarrassment.
The case study
The owner of the bridge, a government transport agency, asked us to assist them to conduct a risk assessment. Their objectives were to:
- Identify, assess and treat the risks to safe and effective bridge opening and closing, so the reliability and performance of the bridge opening system and its approaches could be enhanced in a cost-effective way, thus reducing the incidence of unplanned interruptions to car and boat traffic
- Provide clear documentation of the risks, treatment actions and a Risk Management Plan that ensured effective implementation and ongoing management of the risks through efficient monitoring, reporting and review processes
- Present the findings of the assessment so the outcomes could be understood easily, and in sufficient detail to support and justify decisions about improvement options for the bridge.
Approach and context
Approach
There were several key aspects of the risk assessment approach:
- The risk management process was aligned with the risk management standard ISO 31000, augmented with a failure modes and effects analysis (FMEA) of the main bridge components and the main steps in the operating procedures, to provide an assessment of both technical and non-technical risks
- As part of the process, the consequences of the risks and failure modes were developed as a set of scenarios, including existing controls and emergency responses, to provide a good understanding of the risk as it was currently perceived and the effectiveness of the controls
- The risk treatment development was performed as an integrated activity, drawing on the expertise of personnel from across the transport agency
- The Risk Management Plan not only included the action plans for the current risks, but an ongoing process for monitoring, reviewing and reporting on the risks and the implementation of the action plans, to ensure the risks associated with the bridge, its opening system and its approaches remained acceptable.
Scope
The bridge, its components and associated operating procedures were considered in detail. Individual items were grouped into five elements to structure the risk assessment (Table 1). The assessment was conducted with a group of planners, engineers and maintainers whose expertise spanned these elements.
|
Element |
Items in the element |
|
|---|---|---|
|
1 |
Electrical and controls |
Main drive motors, brake controls, locking drives, gate motors, traffic signals, navigation lights, relays and switchboards, relay logic, control panels, emergency generator and associated connections, auxiliary motors and controls, field devices, power supplies and cables, public address and communications systems, access, maintenance and spares, procedures, documentation |
|
2 |
Mechanical |
Main bearings, drive motor mountings, main brake, gearbox, reduction gears, drive shafts, couplings, locking systems (motors, gears, brake, switches), rest pier, dampers, auxiliary diesel, auxiliary gearbox and clutch, auxiliary drive, emergency generator motor, boom gates and pedestrian gates, access walkways and ladders, maintenance and spares, procedures, documentation |
|
3 |
Civil and structural |
Control drive pier and tower, rest pier, bascule, maintenance |
|
4 |
Operation and incident response |
Operation and incident response Normal operation and maintenance, abnormal faults and rectification, incident response, procedures, response plans, contingency plans |
|
5 |
External factors |
Power supply, lightning, bad weather (particularly high winds), vehicle accident, vessel accident, deliberate damage |
Criteria
Scales were developed for analysing the effects of each risk and the likelihood of those consequences arising. The combined ratings were used to set indicative priorities for management attention.
The most important criterion for analysing the effects of a bridge failure was delay to traffic, for which a five-point scale was formed (Table 2). The durations in the table were selected in part to reflect the effects they would have on commuters and the degree of outrage and adverse publicity they might cause.
|
Rating |
Consequence (impact on traffic) |
|---|---|
|
A |
Catastrophic: traffic delay lasting for several days or more |
|
B |
Major: traffic delay of 30 minutes to a day |
|
C |
Moderate: traffic delay of ten to 30 minutes |
|
D |
Minor: traffic delay of one to ten minutes |
|
E |
Insignificant: traffic delay of less than a minute |
Where risks had safety, environmental or financial consequences, they were ranked in a similar way, using scales tailored to the nature of the consequences being analysed, although there were few of these risks.
A five-point scale for analysing the likelihood of the assessed consequences was also developed (Table 3).
|
Rating |
Likelihood (of the assessed consequences) |
||
|---|---|---|---|
|
A |
Almost certain |
Very high, may occur at least several times per year |
Annual probability over 0.8 |
|
B |
Likely |
High, may arise once a year. A similar outcome may have arisen recently in the past |
Annual probability 0.5 – 0.8 |
|
C |
Possible |
Possible, may arise at least once in a 1-to-10-year period |
Annual probability 0.1 – 0.5 |
|
D |
Unlikely |
Not impossible, likely to occur during the next 10 to 40 years |
Annual probability 0.02 – 0.1 |
|
E |
Rare |
Very low, very unlikely during the next 40 years |
Annual probability less than 0.02 |
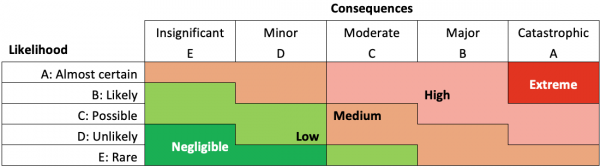
In consultation with the client team. the ratings for consequences and likelihoods were combined to provide an indicative priority for attention (Table 4).
Table 4: Indicative priority for management attention
Risk assessment
Risk identification
Risk identification used structured brainstorming, based on the elements in Table 1, combined with discussions about failure modes more closely aligned to an FMEA approach. The consequences of risks and failure modes were consolidated into scenarios, providing a sound understanding of each risk as it was currently perceived and the effectiveness of the existing controls. In all, 45 risks and their associated controls were identified for analysis.
Risk analysis
The consequences of each risk arising were analysed using Table 2, taking into account the existing controls, and the likelihoods of those consequences arising, again taking the controls into account, were analysed using Table 3. Indicative priorities were developed using Table 4.
The level of consequences if all the controls were to fail in a credible way – the potential exposure – was also analysed for each risk, using Table 2.
Risk evaluation
Risks and their indicative priorities were evaluated by the workshop team, to identify and rectify anomalies and confirm the initial priorities. The team used the indicative priorities as a guide for agreeing a set of high-priority risks to be taken forward for planning more detailed treatment actions in a subsequent workshop.
Ten risks were selected in this way: one rated initially as Extreme and nine rated as initially High. These ten risks, plus some closely related risks with lower priorities, were grouped into seven focus areas for treatment:
- Civil and structural matters
- Electrical faults
- Maintainability
- Bridge operating procedures
- Incidents
- Mechanical faults
- Operator capabilities.
Responsibilities for developing treatment options were allocated to members of the team.
Risk treatment
The risk treatment workshop involved the systematic development of risk treatment action plans, using prepared templates like Table 5 to ensure consistency and completeness. The process was flexible but followed four basic steps:
- Review the current controls and currently proposed actions
- Develop possible additional treatment actions, starting with the options suggested by the responsible individuals
- Brainstorm further treatment options, considering options that: Avoid the risk altogether; Reduce the likelihood or frequency of occurrence; Reduce the consequences if the event does occur; Share some or all of the risk
- Evaluate the options and agree an appropriate approach that reduces the risk to a tolerable level in a cost-effective manner.
Table 5: Analysis of treatment options
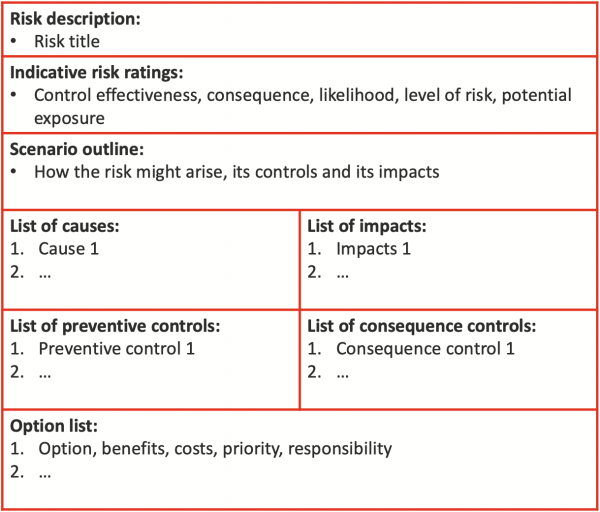
Agreed action plans were then prepared and incorporated into the risk management plan for the bridge.
The one civil and structural risk that was rated Extreme required high-level attention within a very short period.
There were several high-priority risks associated with the electrical and control system, reflecting its age, the presence of single points of failure and the obsolescence of some components. These posed a significant risk to the performance of the bridge.
Several Medium risks were identified where the potential exposure was Catastrophic or Major (using Table 2). For these risks, serious adverse outcomes might arise if the controls were to fail. Responsibilities were allocated for actively monitoring the effectiveness of the controls for these risks.
Lessons
Site visit
A site visit was arranged at an early stage. This was an important activity, as it provided the facilitator with a perspective of the scale and condition of the bridge and its surrounds that could not have been obtained from drawings and photographs. As well as confirming the information contained in site layout diagrams and equipment lists, the actual condition of the bridge and its components could be observed, features that are difficult to record formally.
Site visits are also essential for the credibility of the facilitator. Engagement with workshop participants is hard to sustain without at least some first-hand experience of the matters being discussed.
Setting workshop agendas
Effective workshops require good agendas. An agenda sets the tone and expectations for the workshop, specifies the timetable and, where necessary, allows specialists to make individual contributions to relevant sections without committing to the whole workshop.
For risk assessment workshops, lists of elements like Table 1 form a useful basis for an agenda, as well as providing a structure for thinking about risk identification.
For risk treatment workshops, risks that involve similar treatment responsibilities and functions often form a useful basis, as well as facilitating integrated thinking about improvement actions.
Lists of topics are not sufficient though. The facilitator must anticipate how the workshop will progress and the amount of discussion each item might generate, and then set the timetable accordingly. In our experience:
- Items addressed early in a workshop take longer than those towards the end, as participants adapt to the requirements of the workshop and the discussions and analyses involved
- The facilitator must know when to finalise discussions so useful outcomes can be obtained in the time available
- There must always be flexibility built in to the agenda, to cater for surprises and important matters that require more detailed attention than expected.
Adapting the process
In this case, the approach was aligned with ISO 31000. Some aspects, particularly risk identification, were augmented by elements from FMEA. This suited the technical nature of the risks and their relationship to specific bridge components and operating procedures. It also provided a structure for a comprehensive analysis of all the main systems, components and procedures and their interactions.
It is important to be flexible in your approach to studies like the one described here. Appropriate standards should be used as a guide, but they must be adapted to provide additional value where this can be done easily.
However, adaptation rarely means leaving out important steps. Standards like ISO 31000 for risk management and IEC 61802 for FMEA include steps that are necessary to achieve specific outcomes. While some of them can be simplified, think carefully before you omit them completely.
Setting priorities
Matrices like Table 4 attract criticism because they are often misused. Much of the criticism relates to their structure, the often very narrow interpretation attributed to the relationships between consequences and likelihoods, and the lack of flexibility in the application of the priorities they imply.
Matrices should not be used rigidly. Their purpose is to guide management attention, not to mandate specific responses. If the initial priority generated by the process does not make sense, the participants are expected to adjust it. They should be able to explain why they did this and how they reached their final conclusion. Risk management is based on what people believe, supported by available evidence, not on the mechanistic application of a tool.
Here the consequence and likelihood scales were developed and defined for this application, and the priority-setting matrix was similarly adapted. It was simple and easily used, and fit-for-purpose for setting indicative priorities. In this case, one Extreme and nine High risks emerged from the analysis using Table 4, and they were grouped with some of the lower-priority risks into seven focus areas for treatment planning.
Priority-setting matrices like this should complement and support management thinking, rather than constrain it.
Templates
Templates provide a structured and consistent way of collecting data in a workshop. They help to ensure important information is not omitted inadvertently, they focus discussion, and they provide a record of what was concluded in the workshop and why. The structure of a template keeps the structure of the process in front of the participants, so it encourages a disciplined approach.
Completed templates provide a valuable starting point for future reviews, to allow changes in assumptions to be identified easily and to support and justify changes in decisions where appropriate.
In this case, templates like Table 5 provided clear guidance for risk owners and those who were responsible for implementing improvement actions.
Recording information in well-designed templates improves the efficiency of workshops, enhances the effectiveness of risk treatment implementation, and demonstrates due diligence if that becomes necessary.
References
ISO 31000:2018, Risk management – Guidelines. International Organization for Standardization, Geneva.
IEC 60812:2017, Failure modes and effects analysis (FMEA). International Electrotechnical Commission, Geneva.
- Client:
- State transport agency
- Sector:
- Ports
- Roads and highways
- Services included:
- Technical risk analysis and hazard studies
- Risk assessment and risk treatment