Risk-adjusted forecast of EBIT

Background and purpose
This case concerns a listed company that has the usual requirements for regular, accurate reporting to the securities exchange. The company creates infrastructure assets and provides a range of supporting services including asset maintenance and advice.
The company has eight main business units, grouped into five divisions. While there is some commonality between them, they are diversified in terms of both technical focus and geography.
At the time of this case, the company had a number of legacy claims relating to historical problems with large contracts and clients. Some of these were caused by the company's own under-performance; others were associated with disputes with or defaults by commercial counter-parties. The impact of these issues, alone and in aggregate, was judged to be material in an accounting and reporting sense.
The company had a recent history of disappointing the securities market by failing to meet the profit targets it announced. The new CEO wanted to develop a risk-adjusted forecast of earnings before interest and tax (EBIT) that he could announce to the market with a high degree of confidence that it could be achieved.
EBIT review
Overview
In August, members of the senior executive team from the corporate business and the main business divisions reviewed the EBIT and claims forecast for the current accounting year ending on the following 30 June. The review considered the primary drivers of variability in the EBIT forecasts and the legacy claims, developed scenarios, and estimated ranges for the potential EBIT outcomes. A simulation model was used to combine the range estimates into a forecast distribution of EBIT at 30 June.
Structure of the review
The review examined:
- The variability of EBIT for ‘business as usual’ in each business unit
- Correlation between earnings from the business units
- Additional earnings effects due to legacy matters.
For each business unit, the review considered:
- Background context information about the unit, including its recent performance, its business environment and its strengths and weaknesses
- Major drivers of variability in revenues and costs
- Scenarios and ranges of EBIT for core business activities.
For the legacy claims, the review considered:
- Background context information about the claim and its circumstances, including the current status of any legal and recovery actions
- Potential scenarios that might result in gains or losses for the company (compared to current accounting provisions, if any), during the remainder of the financial year
- Ranges of EBIT for the scenarios, and their probabilities of arising where relevant.
Key factors and assumptions associated with each estimate were recorded. EBIT ranges were developed as three-point estimates (P10, most likely and P90 values) and interpreted as triangular distributions (Figure 1). Scenario probabilities were also estimated for the legacy items (Figure 2).
Figure 1: Interpreting an EBIT range estimate
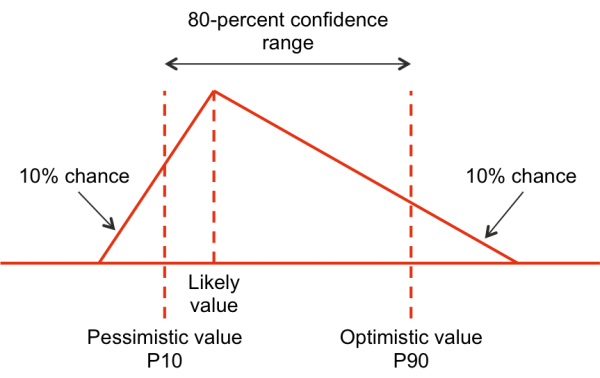
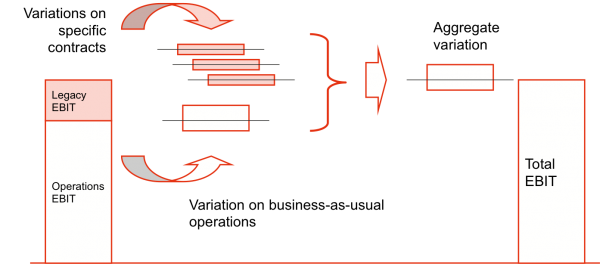
Figure 2: Structure for legacy items

The distributions and probabilities were represented in a simulation model that estimated the variation in EBIT around the current forecast value, taking into account work in progress allowances and provisions.
Figure 3: Combining range estimates
Variation data
Variation data was developed by the executive team in a structured workshop and recorded. Items recorded included:
- The basis for the EBIT forecast, whether it was considered to be broadly aggressive (on the high side), neutral or conservative (low), and the underlying reasons for that judgement
- Drivers of variability for revenue and costs
- Optimistic, pessimistic and likely scenarios, the EBIT variations associated with each of them, and the scenario probabilities where relevant
- Links to other parts of the business.
Some of the factors that drive variability that were considered when discussing variations are shown in Table 1.
|
EBIT component |
Driver |
Notes, inclusions |
|---|---|---|
|
Revenue |
Sales volume |
Economic conditions, market conditions, demand growth, new work |
Rates |
Competition, pressure on margins |
|
Capacity |
The company’s capability and resources; capacity to satisfy demand, long-lead items |
|
Receipt of revenue |
Timing, bad debts, effects of climate on some projects |
|
Other factors |
Forms of contract, escalation rates built into contracts |
|
|
Cost |
Rates |
Cost base, escalation, enterprise agreements, cost of finance |
Rework |
Project technical content, latent conditions |
|
Utilisation |
Productivity of labour and equipment, ability to transfer resources between business units |
|
Purchased items |
Escalation, imported equipment and materials, foreign exchange variability |
Correlation
There are common drivers of variability across the group that mean the EBIT results for business unit are likely to rise and fall together to some extent. Table 2 explores some of the factors relating to the correlation of business results.
|
Factors supporting independence |
Potential common drivers |
|---|---|
|
Units do not have the same core businesses, and they tend work with different clients in different market sectors Units work in different geographical regions There are few synergies and cross-selling opportunities between units that are exploited currently At Divisional level, there are different management teams and business processes |
The corporate performance of the group influences market perceptions of all units, with effects on revenues (attractiveness for clients) and expenses (availability and price of labour) The rating of the group by credit providers (formally or informally) affects interest rates and hence the cost of working capital Contagion effects of a few large and public contractual losses leads to reduced attractiveness of the group as a business partner or counter-party |
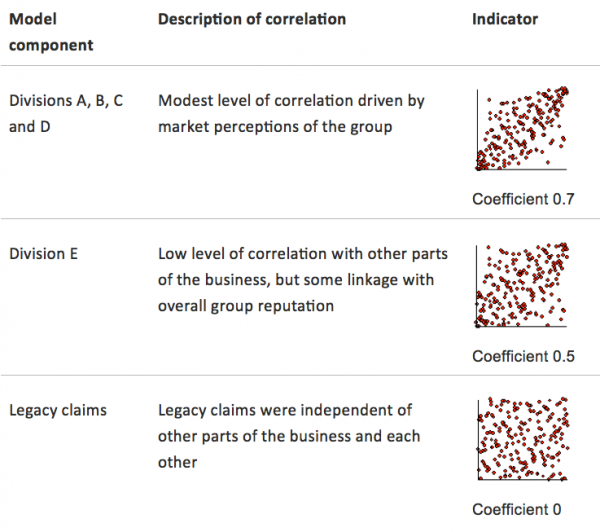
A limited amount of correlation between the variation distributions was incorporated in the model, as noted in Table 3.
Table 3: Correlation assumptions
Additional matters for legacy items
Legacy items often have long and messy histories, the facts may be in dispute, legal proceedings may have commenced and in many cases provisions have been made in the accounts.
As well as the matters noted above for more ‘standard’ variations, discussions about legacy items also included:
- Accounting matters such as bad debts, specific provisions and work in progress
- Commercial matters such as the form of the contract, the contractual scope for variations claims and the terms associated with liquidated damages
- Technical matters such as deficiencies already identified and the possibility of future technical problems
- Claims history, current claims and potential future claims
- History of dispute resolution, negotiations and settlements
- Arbitration and legal determinations, and the status of any matters before tribunals or the courts.
Detailed commercial, technical and legal advice was sought for most of the legacy items.
Outcomes from the review
Benefits
The review produced the information required for the modelling and the quantitative forecast. It also generated significant benefit for the management team by providing a structured framework within which the complicated mix of scenarios and uncertain forecasts could be explored.
Broadleaf’s structured process and facilitation allowed the team to describe, clearly and methodically, what was known and what was uncertain. Despite the complexity of the situation they faced, this was achieved efficiently and made only limited demands of the team’s time. The understanding they came to through this process improved their ability to manage the business and removed the burden of well meaning but fruitless discussion and argument that often surrounds such difficult business management challenges.
Risk-adjusted forecast
Figure 4 shows the risk-adjusted forecast of EBIT derived from the quantitative model developed in this review. (Note that the forecast numbers have been adjusted for commercial reasons.)
Figure 4: EBIT forecast distribution
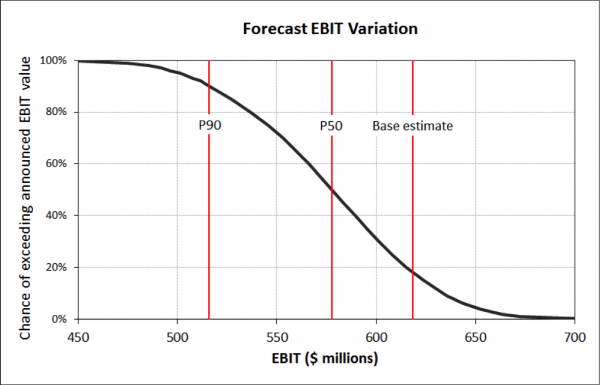
The pre-review EBIT estimate, marked as the base estimate in Figure 4, was at the P19 level, so there was about a 1 in 5 chance that it would be exceeded.
Expressed another way, if the base estimate of EBIT were announced, there would be a chance of about 4 in 5 that the EBIT forecast would not be achieved. This was far too aggressive for the new CEO, who chose to announce a lower and hence far more conservative forecast.
The CEO had reached the conclusion that the current forecast was aggressive part-way through the review process, on the basis of the detailed discussions and analyses that took place. The output from the review and model confirmed his intuition. It provided him with a far more specific guide on which to base his EBIT forecast announcement.
- Client:
- Listed company in the engineering construction and services sector
- Sector:
- Mining and minerals processing
- Water
- Rail
- Energy
- Services included:
- Project risk management
- Quantitative modelling
- Cost uncertainty