Upgrading refineries for clean fuels
Summary
This case illustrates the value of qualitative and quantitative risk analyses in refinery upgrades that had to be completed within the strict time constraints imposed by tight shutdown windows. It describes just one of our assignments in this field.
In this case, schedule impacts drove the qualitative assessment, and a quantitative analysis of uncertainty associated with the schedule was completed. Several forms of sensitivity analysis were used to highlight where additional project effort might be able to reduce the risk and improve the project outcomes e.
The clean fuels upgrade project
A refiner needed to upgrade two of its refineries to meet proposed new clean fuel standards. In particular, upgrades were needed to reduce the amount of benzene in petrol and to reduce the sulphur content of its diesel product.
Benzene Reduction Units (BRUs) were to be installed in each refinery, using the most technically and commercially appropriate technology, and the capacities of the Diesel Hydrotreatment Units (DHUs) in each refinery were to be expanded. The project would also de-bottleneck the associated areas of the refineries.
The upgrade would use proven technology.
An important aspect of the project was the need to integrate with and not impede refinery shutdowns that were already scheduled with tight time windows.
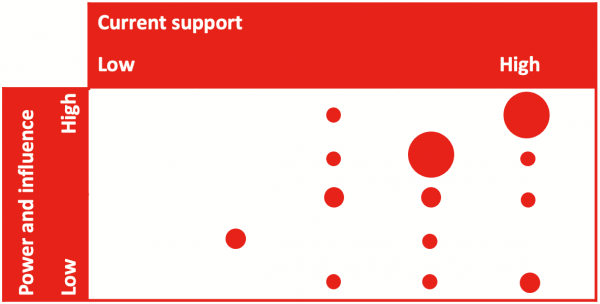
There was good stakeholder support for the project (Figure 1).
Figure 1: Stakeholder analysis
Initial qualitative risk assessment
Purpose
The initial risk assessment used a qualitative approach. It had two primary functions:
- To provide input to the project team on priorities for management actions to improve project outcomes
- To provide an input to the quantification of schedule risk for the project.
Approach
The risk assessment process followed the company’s risk management framework, aligned with ISO 31000. Risks were interpreted as deviations from what was expected or planned to occur. Most of the deviations identified represented negative impacts on desired objectives.
The assessment was structured around a set of topics, known as key elements, for each refinery. They covered the main tasks for the upgrade project, based on past work with similar projects and adjusted to reflect local conditions.
There were workshops for each of the refineries. Senior members of the project team and site representatives from the refineries participated in the workshops. They had been asked to prepare lists of the top five risks they perceived for the parts of the project for which they had responsibility, and for the project as a whole.
For Refinery 1, the workshop addressed each key element in turn to:
- Briefly review the area covered by the element, to ensure everyone attending was using a common set of definitions and assumptions
- Identify the most significant potential risks that might impact on the element
- Note existing controls relating to each risk
- Assign consequences and likelihoods, given the controls
- Establish initial prioritiesfor action to improve the chances of a successful outcome.
For Refinery 2, to make efficient use of the project team’s time, the workshop process was revised to:
- Review the initial risks identified for Refinery 1
- Delete risks that were not relevant to Refinery 2, or reword those that needed adjustment
- Insert new risks specific to Refinery 2
- Review the consequence and likelihood ratings and adjust as necessary
- Establish initial priorities for action to improve the chances of a successful outcome.
Criteria and risk assessment scales
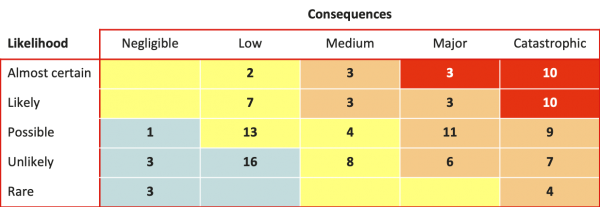
The company’s criteria for project success are summarised in Table 1.
In practice, the qualitative risk assessment dealt almost exclusively with events having schedule impacts, due to the importance to the business of refinery production and the emphasis placed on completion of shutdowns within planned windows that were acknowledged to be tight. In particular:
- Safety-related risks had been addressed in previous workshops, although it was important to ensure that actions designed to treat risks identified by this process did not give rise to fresh safety risks
- Technical changes had been the focus of detailed HAZOPs; they were not addressed in this exercise, except to the extent they may have had important schedule or cost impacts
- As the primary focus was on the shutdown schedule, important objectives relating to environmental and other compliance obligations, and the reputation and image of the company, were outside the direct scope of the initial assessment. These were addressed by the client in separate work.
|
Criteria |
Targets |
|---|---|
|
Safety |
Zero recordable injuries Zero significant safety incidents |
|
Cost |
Meet the approved capital costs within 10%, based on a contingency assessed as having a 50% probability of achievement Complete the work for less than 90% of the average cost for a project of this kind |
|
Schedule |
Achieve average execution time for a project of this kind All plant shutdowns completed within 2 days of the planned duration |
|
Operability |
Achieve design specifications Operational availability following the shutdown greater than benchmarks, measured from six months after start up |
The consequence scales used in the workshop were linked to the criteria in Table 1. Likelihood scales were based on an indicative frequency of the assessed consequences arising, given the controls.
Risk assessment outcomes
The risk profile for Refinery 1 is summarised in Figure 2. The relatively large numbers of Extreme and High risks was due to the nature of the rating scales that were used, and the schedule consequence scale in particular. Because there were many potential events with associated delays of five or more days, a significant delay given the very tight shutdown window, there were many risks with high consequence ratings, and hence Extreme or High initial priorities. Some of these were downgraded on later examination, but many remained as potentially severe threats to attaining the schedule. The profile for Refinery 2 showed similar characteristics.
Figure 2: Risk profile for Refinery 1
Quantitative schedule risk analysis
Overview
Discussions with members of the project team and planners were used to generate initial schedule models for the refineries. These were simplified versions of the project schedule, addressing the main activities in aggregate and highlighting the most important links.
Detailed discussions were held with the project team to identify uncertainties for the activities in the schedule and develop activity duration estimates as distributions. The risks identified in the qualitative workshops were an input to this process, as were the estimates in the project schedule.
The schedule model and the preliminary results were reviewed and checked with the project team, to ensure it reflected expectations and to clarify the main drivers for the schedule outcomes. Detailed quantitative outcomes were then generated from the model. They were discussed with the project leadership and their implications were examined.
Operational and modelling assumptions
Project activities at the refineries were assumed to overlap to achieve schedule reductions where possible, in particular:
- Pipe modelling, procurement, fabrication and installation would overlap
- Preparation of contract packages would start as early as possible, and details would be finalised after designs had been completed.
Many finish-finish relationships with lags were used in the schedule model to represent overlapping activities.
Uncertainties in activity durations were modelled as three-point estimates, associated with optimistic (P10), most likely and pessimistic (P90) scenarios. In most cases the chance of over-runs was larger than under-runs, leading to expected outcomes, mean values, that were higher than the most likely outcomes.
The distributions for shutdown duration were strongly peaked:
- The optimistic and likely outcomes were close together
- A two-week delay was possible, but unlikely; it was associated with vessel internals not being as expected and hence requiring re-engineering and work-arounds during the shutdown period.
Quantitative outcomes
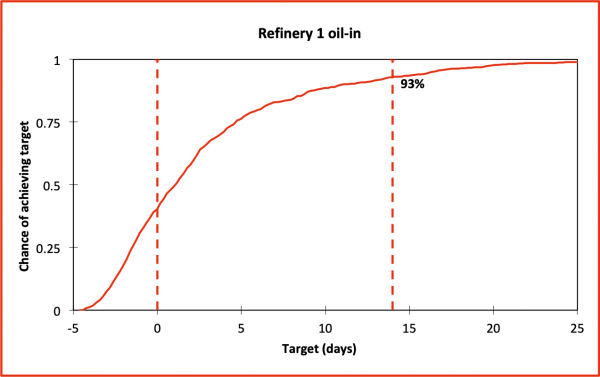
The shutdown window for Refinery 1 was tight, but seemed achievable (Figure 3). There was a 93% chance of completing the work within the fourteen-day shutdown period.
Figure 3: Refinery 1 shutdown completion
The main drivers of the Refinery 1 shutdown milestone (Figure 4) were:
- Mechanical works, particularly piping (solid bars)
- Compressor procurement and installation (shaded bars)
- Shutdown activities themselves, including tie-ins and vessel internals (clear bars).
Figure 4: Drivers of Refinery 1 completion
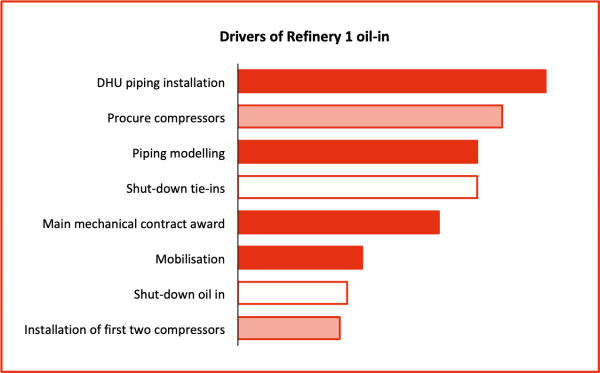
The strongest influence on Refinery 1 completion was pipe installation. Piping and associated modelling, including isometrics (assuming smart working and overlapping of engineering, modelling and isometrics), was a prerequisite for:
- The main mechanical contract package release (FF relationship with lag)
- The main mechanical contract award (FS relationship)
- The main mechanical contract mobilisation (FS relationship)
- Piping installation (FS relationship)
- Civil works package execution (SS relationship with lag).
The project team was actively seeking to optimise compressor procurement and installation, including the demolition of existing compressor units, and associated risks for other aspects of refinery operations.
For operational reasons, a stock of diesel was needed at Refinery 1 before the Refinery 2 DHU shutdown could start, linking the two shutdown programs to one another. This meant the Refinery 2 DHU schedule did not seem attainable in the way it was initially planned, as it was being driven by the shutdown and subsequent production period at Refinery 1 (the right-hand curve in Figure 5). Breaking this link could potentially save weeks and reduce risk, as shown in the left-hand curve. This became an additional focus for the project team. They reworked the schedule and sought other sources of start-up diesel, taking account of the outputs of the analysis and the sensitivities identified from the model.
Figure 5: Relationship between Refinery 1 and Refinery 2 completion
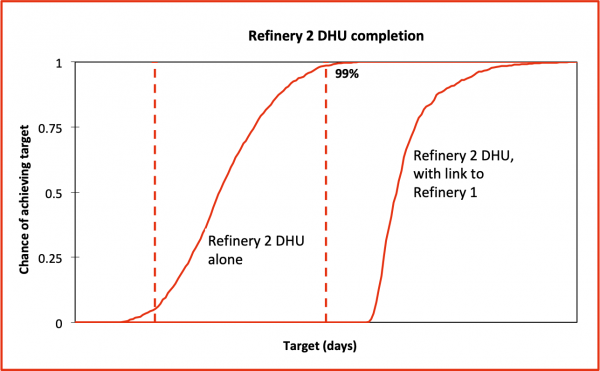
Achieving the schedule milestone targets would require very efficient working throughout. A high level of efficiency was a key assumption in the schedule model. However, the targets did not seem to be out of reach, providing the link between Refinery 1 and Refinery 2 could be removed.
Lessons
Qualitative risk assessment
The initial qualitative risk assessment was a useful starting point for the project team. As well as drawing attention to risks that the project team needed to address, it provided an important input to the quantitative risk analysis. It also helped the project team think more broadly when they were developing scenarios for the schedule risk analysis.
Schedule risk analysis
Quantitative analysis of schedule uncertainty is particularly useful if there are short shutdown windows. Shutdowns are planned tightly, so anything that might cause disruption must be recognised well in advance so counter-measures can be implemented.
In many projects there is a heavy emphasis on uncertainty in the capital cost. In this case, though, capital cost uncertainty was limited and of less importance to the business than the impact of schedule uncertainty because the project involved proven and readily available technology. Capital cost variations would be swamped by production and revenue losses if there were to be a delay to restarting operations after an unexpected extension to a planned shutdown period.
A great deal of value was derived from straightforward and relatively compact models. It is not necessary to expend a large amount of modelling effort to help a project team make sense of the challenges they face and devise strategies to deal with them. The models provide a framework for a productive discussion of priorities and possible risk treatment plans.
Project optimisation
The quantitative analysis was not just a modelling exercise. It provided the project team with a framework within which they could work together to identify specific focus areas that would address aspects of the schedule that had not been foreseen as critical.
In particular, identifying the main drivers of uncertainty, in diagrams like Figure 4, demonstrated clearly where additional effort would be worthwhile. Examples like Figure 5 that demonstrated the impacts of project options – like breaking the link between refineries, which had not appeared to be critical in the deterministic plan – were also valuable for focusing management attention. Understanding the significance of the link enabled the team to adjust their plans to improve the chance that they would succeed.
Three specific areas of project optimisation were identified:
- Management of all aspects of piping
- Compressor procurement and installation
- Close integration of the upgrade project with other aspects of the refinery shutdowns
- Client:
- Oil refiner
- Sector:
- Oil and gas
- Services included:
- Project risk management
- Schedule uncertainty
- Quantitative modelling