Reliable power for a remote mine
Summary
We worked with the owners and operators of a remote mine to examine the reliability of its power supply. There was no access to the regional electricity grid, so the mine generated its own power to meet its current needs as well as those of surrounding communities. A planned mine expansion meant that the power generation and distribution capacity for the plant needed to be upgraded. This prompted the need for a risk assessment.
Background
The requirement
Our client operates a mine and processing plant in a remote location, with no access to the regional electricity grid. It produces its own power, primarily from diesel and geothermal generators, which it uses for its own operations and to supply local communities.
A planned mine expansion would require additional power, and hence new generation capacity. Providing additional power would have to address the reliability of the local network, which was already under strain from growth in demand from both the mine and the community.
This case outlines how we helped the mine manager think about the risks and opportunities associated with the power system upgrade. The purpose was to support his application for funding approval, as well as implementation of the upgrade project.
Our approach
Several techniques were considered for this assignment, including a Failure Modes, Effects and Criticality Analysis (FMECA), but these approaches tend to focus the attention on the hardware. While the hardware was part of the problem, it was not the only important aspect. It was agreed that the breadth provided by a more general qualitative risk assessment would provide the most useful information for the effort involved and, if a particular hardware issue was highlighted, then further analysis using a more focused technique could be performed.
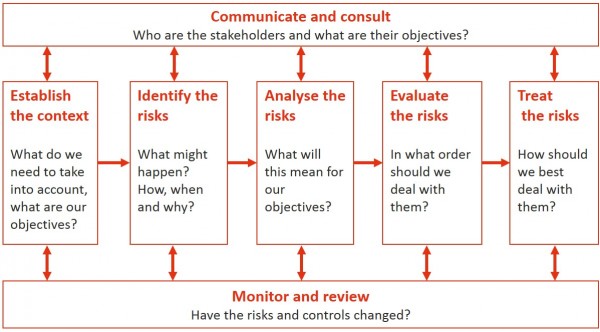
We facilitated a process that was aligned with ISO 31000, Risk management – Principles (Figure 1), working with members of the project team, mine operations, the processing plant and electrical engineering consultants.
Context setting was completed with the project team. A risk assessment workshop followed, focusing on the middle three boxes in Figure 1, risk identification, analysis and evaluation. Options for treating the high-priority risks were developed later.
Figure 1: Risk management process, ISO 31000
Scope, context and criteria
Scope
The scope of the risk management activity included:
- Power generation
- Distribution to mining operations
- Distribution to the processing plant
- Distribution to local customers, including surrounding communities.
Context
The stakeholders include the mining company itself, its employees and contractors working in and around the mine and processing plant, local suppliers, the local community, local landowners, environmental NGOs and the government.
The mine is in a remote area, close to the sea. The location is subject to weather extremes, including high rainfall, cyclones and storms, all expected to be exacerbated by climate change. The area is seismically active; while this supports extraction of geothermal energy, there are risks of both tsunamis and earthquakes.
Remoteness poses internal challenges, including the requirement for fly-in-fly-out (FIFO) operations and limited availability of specialist technical staff. In particular the four roles of network owner, network engineer, network operator and network maintainer were not all filled, and only one person was on site during each FIFO roster to perform all these roles.
Criteria
The criteria for describing the consequences of identified risks (Table 1) were derived from existing company-wide criteria used for risk analysis, linked to corporate objectives, with adjustments for this project. Where a risk might impact on several criteria, the highest consequence criterion was used to determine the rating. The levels of risk determined this way ensured nothing important was allocated a low priority and set aside inappropriately.
|
Criterion |
Notes, components |
|---|---|
|
Health and safety |
Injury or death of an employee, contractor or a member of the public |
|
Environment |
Toxic release or environmental damage |
|
Community |
Impacts on highly valued structures or items of cultural significance, social impacts or community complaints |
|
Property |
Property loss, measured in dollars after insurance recovery |
|
Process |
Production loss, measured initially in lost shifts |
The company’s analysis scale for process loss was not appropriate for this project:
- It did not differentiate adequately between losses for the scenarios envisaged for this project
- It was expressed in terms of dollars of lost margin that were not familiar to the project team.
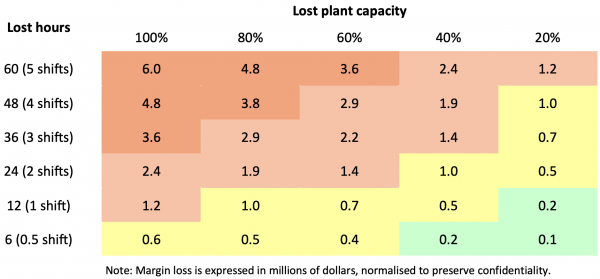
A new reference table (Table 2) was developed to relate hours of lost production and the percentage of the plant affected to the cash margin foregone. This allowed the project team to make their assessments in the workshop using familiar terms and direct estimates of lost hours and lost capacity. These assessments could then be linked, outside the workshop, with the company’s accepted risk management processes and scales.
Table 2: Reduced production and margin loss
Risk assessment
Risk identification
Risk identification was structured around ten key elements, determined during the context step (Table 3). For each element the workshop team used structured brainstorming to identify the main risks and the controls in place for each one. The consequence of each risk and the likelihood of that level of consequence was assessed before moving to the next key element.
|
Key element |
Topics included |
|---|---|
|
Power generation |
Power stations (fuel oil, interim, geothermal); number of generators; connectivity; reliability; redundancy |
|
Power distribution |
Equipment (substations, feeders, interconnectors, transformers, bus bars, circuit breakers, cables, etc.); connectivity; reliability; redundancy |
|
High voltage loads |
HV motors such as SAG mills and MAC motor |
|
Earthing and protection |
Adequacy for safety, reliability and operability |
|
Maintenance of electrical systems |
Maintainability; legacy systems; upgrading; monitoring; SCADA; maintenance, reliability and availability modelling; documentation (procedures, line diagrams, maintenance manuals, isolation) |
|
Human resources |
Strategies for attraction and retention, training, organisation, contracting strategy, accommodation |
|
Systems and processes |
IT and methods of work; security and safety; data and information protection |
|
Relocations and disruptions |
Utilities, roads, electricity, telecommunications and pipelines |
|
External stakeholders |
Neighbours, landowners, communities, suppliers, NGOs, Government agencies |
|
Natural events |
Climate change, extreme weather events, fires, seismic activity, pests and diseases |
Analysis and evaluation
The combination of the consequence and likelihood ratings generated an initial priority for each risk, using four levels of risk: Extreme, High, Medium or Low. To provide comparability across projects, the company’s usual risk management process was used for setting priorities, with the production loss scale modified as noted above.
The assessment for each risk also generated ratings for:
- Control effectiveness, a rating of how well the company’s controls were designed and implemented, compared with what a similar but best-in-class company might achieve
- Potential exposure, the maximum consequences that might be experienced were all the controls to fail.
These additional ratings were also used to set priorities, as discussed in more detail later.
Workshop outcomes
During the workshop, 67 risks were identified, of which 14 were assessed as Extreme. There were very few assessed as Low. There might be several reasons for this:
- During the identification process, participants intuitively discard risks the that they perceive, rightly or wrongly, to be less significant
- For an important but relatively small project like this, the company-wide consequence levels (apart from those measuring production loss) have limited granularity
- The priority-setting calculation is skewed towards the higher ratings, with more combinations of consequences and likelihoods allocated to higher levels of risk than to medium or low
- Most power loss consequences were given a Frequent likelihood, corresponding to a frequency of several times per year, which led to an Extreme level of risk; this reflects the low confidence the electrical engineers had in the reliability of the network
- Where there was a possibility of a fatality, the team nearly always over-estimated the likelihood compared to historical experience, and this usually led to a very conservative Extreme level of risk, not aligned with other levels of risk but perhaps not too inappropriate for safety-related risks.
Because the electricity generation and transmission network had evolved organically over time, without an overarching strategy, it was no surprise that many risks were generated with high priorities. A large proportion of the risks were in the areas of earthing and protection; maintenance; and systems and processes.
Subsequent activities
Priorities for risk treatment
Treatment strategies to either change the consequences of a risk or change the likelihood of it occurring were to be identified at a later workshop.
It is usually not possible to implement all desirable risk treatments at once. In this case there were 67 risks identified, of which 14 were rated as Extreme and 38 had potential exposures that were rated as Catastrophic. The risk analysis provided guidance about which risks and associated treatments should be examined first.
Initial priorities
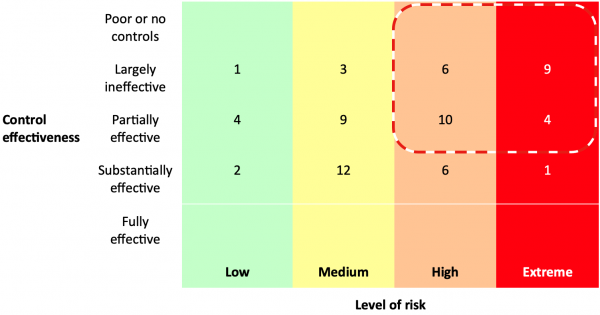
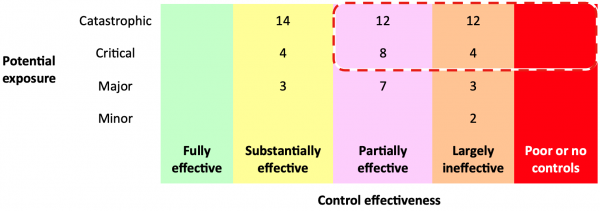
While the level of risk, based on the consequences and likelihood of each risk, is a useful starting point, control effectiveness provides additional insight into treatment priorities. Table 4 shows the numbers of risks by level of risk and control effectiveness.
The risks in the dashed box should receive priority for the development of treatment plans. For these risks, the control effectiveness rating indicates that there is more that can be done to improve the design and implementation of the controls. Addressing these risks may be more worthwhile that expending effort on the Extreme risk for which the controls are Substantially effective, where only marginal improvements may be possible.
Table 4: Priority for treatment
Assurance priorities
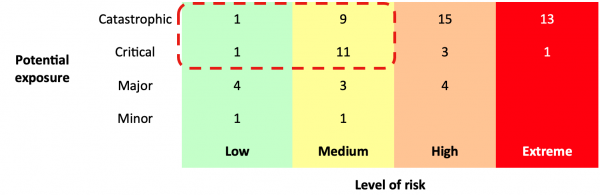
Potential exposure provides insight into those risks for which the controls are important, and hence a guide to where control assurance effort should be directed, shown in the highlighted area in Table 5.
Focusing on risks for which the level of risk is Low or Medium may seem counter-intuitive, but there are several reasons for this:
- Managers are likely to be improving the controls for Extreme and High risks already, so assurance activities at the same time may not add much additional value
- When risks are Low or Medium, they may be ignored – ‘Nothing to see here!’ – leading to complacency and lack of attention, even though a control failure might be devastating for the project.
Table 5: Priority for assurance
Vulnerability
Potential exposure and control effectiveness together indicate where the project might be particularly vulnerable. In the highlighted area in Table 6, the controls can be improved, and the consequences of a control failure might threaten the success of the project. Risks in this area, and the associated treatment or improvement plans, should be monitored closely.
Table 6: Vulnerable areas
Lessons
Tailoring consequence criteria for projects
Many organisations like to use a single risk assessment process, with a common set of criteria and scales for setting priorities. This ensures consistency and comparability across the organisation and between projects, and it supports rational allocation of capital and other resources. However, criteria and scales set at the corporate level may not always appear relevant or useful for a specific project, and the words and measures used to describe them may not be readily understood by the people who must use them.
In this case study we converted corporate measures of lost production in dollar terms into operational criteria related to hours lost and the percentage of production affected, all familiar concepts for operations and maintenance people. The criteria set at corporate level were not changed fundamentally, just tailored for this specific project.
We have used similar processes in other settings. For example, for a coal miner, we evaluated plant downtime in terms of trainloads of coal delayed, and (outside the workshop setting) used the profit margin on a trainload of coal to align this way of thinking about consequences with the corporate scales that used dollar impacts.
Generally, it is better to adapt the language in the risk management process and scales to the language of those involved in using them. This allows workshop participants to make sensible contributions in terms they understand. If they need to think radically differently and use unfamiliar concepts, they may struggle with the task, disengage from the process, and provide unreliable analyses.
Additional analyses to assist in setting treatment priorities
Where there are many risks and treatment actions, a highly organised list of prioritised actions can provide some direction for improvements.
Initial priorities based on levels of risk give an overall view of which risks may be of most concern and needing prompt attention, but they do not present a complete picture by themselves. Control effectiveness provides extra insights about which risks require more urgent treatment, to improve the design or the implementation of the set of current controls.
The use of potential exposure ratings along with the risk priority helps to set priorities for assurance actions, as the analysis can pinpoint those risks that can have major impacts, while seeming to be under control.
When further combining potential exposure and control effectiveness, the treatment plans that need to be completed promptly are highlighted, as any delays in completing those actions could lead to serious consequences.
A general tutorial about setting priorities is available here.
Positive and negative impacts of risk
The consequence criteria (Table 1) were taken from the company-wide risk criteria and were written as negative impacts due to an incident or activity related to the mine. This is a common issue when examining risks for a project, as participants in a risk assessment are naturally on the lookout for anything that can go wrong. However, it can constrain the team’s thinking unless there is a process for identifying opportunities to improve the project or process.
In this case, a feature of this perspective of looking at opportunities as well as the downside helped the team to identify potential options to provide a more reliable power supply, perhaps more cheaply or more sustainably. The positive impacts of these options would affect not only the mine site, but also the local communities which, in turn, might also provide the mine operations more positive publicity and support from the community and government.
Taking a strategic view
The power supply at the mine evolved organically, in a piecemeal way, to support changes in plant operations and community requirements. In consequence, at some point it became unreliable and difficult to manage, with legacy issues from older equipment, several different equipment manufacturers, out of date manuals and onerous maintenance schedules.
An underlying cause for this situation is likely to lie in the mine’s planning processes. As the power supply is a utility and therefore perceived as providing merely a supporting role in delivering profit for the facility, it was not examined in the planning process with the same diligence applied to the main processing plant. This was a major planning failure.
Taking a broader approach
The focus of the risk assessment was very much on keeping the electrical network operational for the mine. In practice, consequences were mostly focused on blackouts, production losses, equipment damage and injuries or fatalities. Very few risks had consequences that primarily impacted the environment or the community. While this may reflect reality, it might instead be an outcome of a workshop involving a group of technical personnel (particularly electrical), with no representatives of community interests.
More involvement with other personnel with an understanding of the environment and community relations in the context stage, as well as at the workshop, may have resulted in a more outward-looking assessment, which would also improve community acceptance of the mining operations. This does not imply that community members should be invited to participate in all internal workshops – that is not usually appropriate – but their interests should be represented by, say, the company’s community relations team.
This mine site generated its own power using diesel and geothermal generators. It didn’t rely on just one technology but spread its risk by using two and later three different technologies. This reflected the site’s low risk tolerance for loss of power due to a single mode failure.
With the acceleration towards the use of green power and the consequent need to rely less on fossil fuels, the need to diversify will only become greater. The use of geothermal power in a location that has a lot of seismic activity was an obvious choice, even though it was not a particularly reliable source of power at the time the decision was made.
Involving other stakeholders with a more holistic view of the mine and its place in the world, not just the company, would help ensure that decisions made for this project were useful over the longer term for the mine and the surrounding community it supports.
- Client:
- International resources company
- Sector:
- Mining and minerals processing
- Energy
- Services included:
- Technical risk analysis and hazard studies
- Risk assessment and risk treatment