Achieving the life-of-mine plan
Summary
The operator of a large gold province needed to update its Life-of-Mine Plan (LMP), and to incorporate risk and uncertainty in it.
The LMP was an important input to the analysis of future capital investments in the mine for both the operator and the owners. For the operator, the LMP was its main strategic plan, and core to its business. For the concession owners, the LMP formed an important strategic input to their own corporate planning processes. It provided inputs to their capital structure plans and treasury management activities, particularly their long-term hedging strategies.
The LMP formed the base for a simplified model of the mine operations over a multi-year period. Managers developed scenarios and estimates for the variability in key inputs to the plan. The simulation package @Risk was used to generate distributions of the main financial and operating measures of performance for the mine.
The model developed a set of outputs that were important inputs to:
- Capital investment plans for the operator, and funding plans for the owners
- Long-term capital structure and funding analysis for the owners
- Hedging strategies for the owners and their treasury functions.
By requiring quantitative estimates of the main operating parameters of the mine and mills, the modelling exercise encouraged managers to think in detail and with some numerical precision about their areas of responsibility. Their awareness and understanding was enhanced, leading to greater flexibility and responsiveness in their plans and greater organisational preparedness. The sponsor for the risk analysis reported a very positive cultural change following the exercise.
The Life-of-Mine Plan
The operator was required to update its Life-of-Mine Plan as part of its obligations to the consortium that owned the concession. The province contained open pit and underground mining areas, and several processing circuits for different kinds of ore. As part of the operator's improvement of its management information and decision-making tools, the new plan was to incorporate risk and uncertainty. Wider adoption of risk management and risk analysis processes was part of the operator's move towards best management practice.
For the operator, the LMP was its main strategic plan, and core to its business. It contained predictions for future production under a set of development scenarios, and detailed proposals for specific development activities in the short- and medium-term.
Approach and base model
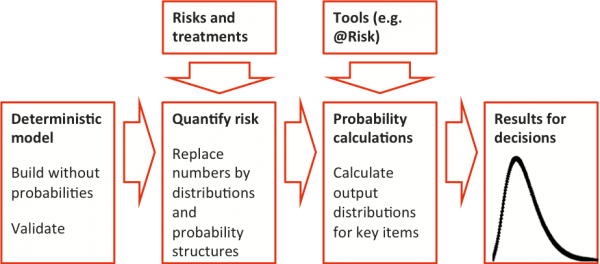
The general approach to risk analysis was extended, for application to the mine plan, to include more detailed quantification (Figure 1).
- The process began with a base model, containing no probabilities. In this case, the model was the Excel spreadsheet used for the mine plan. It was large, incorporating a number of Excel workbooks and significant detail, not all of which was needed for risk analysis. It was suitably summarised, and validated in its simplified form.
- The model contained both physical measures (operating throughputs, head grades, recovery factors and so on) and related financial measures (extraction cost per tonne of underground ore, haul cost per tonne of waste from the open pit and so on).
- The main outputs from the model were financial measures like operating revenues and net present value, physical measures of production like ounces of gold extracted and related performance measures like net operating cost per ounce.
- Sources of variation in the model were identified (opportunities and threats), and appropriate management responses were considered. This assessment was used as the starting point for analysing variations to substitute distributions of outcomes for single value estimates. The distributions were included in the base model so that its underlying structure and the functional relationships within it were unchanged.
- The risk simulation package @Risk was used to calculate output distributions for the key decision variables.
- Additional analyses were undertaken to test and extend the conclusions.
Figure 1: Quantification approach
The simplified model of the LMP focused on the key inputs and outputs in a small number of categories:
- Operating parameters and associated cash costs
- Operating revenues
- Capital expenditure
- Cash flows through time
- Operating costs per ounce
- Net present values.
Cash operating costs included mining costs for each open pit and underground area, milling costs for each circuit and support costs. Milling costs were only estimated for the main circuits. Information included in the model for each circuit is shown in Table 1.
|
Item |
Units |
|---|---|
|
Ore milled |
tonnes ‘000 |
|
Fixed costs |
$ ‘000 |
|
Variable costs |
$ / tonne |
|
Circuit milling costs |
$ ‘000 (calculated) |
|
Head grade |
g / tonne |
|
Recovery |
% |
|
Ounces of gold recovered |
oz (calculated) |
Operating revenues in local currency were calculated from the gold production from all the mill circuits, the gold price in USD and the exchange rate.
Capital spending included capital development, sustaining capital, capitalised exploration and evaluation, and project capital. Depreciation and amortisation, working capital movements and taxation were also included.
Key outputs included operating cost per ounce of gold produced, net present operating costs and pre-tax and post-tax net present values.
The risk model used the values from the LMP model as the basis for its calculations.
Risk identification and estimation
Risks are sources of variation in the model. They arise from operational matters and they reflect anticipated operating conditions and decisions. In this case, risks included all variations from the plan, both positive and negative, so opportunities were considered as well as threats.
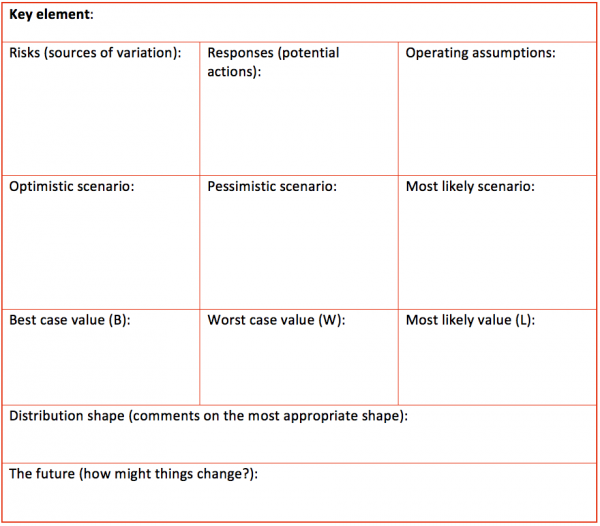
Managers in the business areas attended a briefing session at which they were introduced to the main concepts of risk management, the approach being adopted for incorporating risk into the LMP, and the process for generating risk variations. The worksheet for the estimation task is shown in Table 2.
The managers performed the following steps to complete the worksheet:
- Identify the main opportunities and risks (sources of variation);
- Think about the management responses if the variation were observed;
- Take suitable action if needed;
- Note the main operating assumptions;
- Describe an optimistic scenario in words, and then quantify the outcome;
- Do the same for a pessimistic scenario;
- Then do the same for a most likely one;
- Choose a suitable distribution shape.
The sequence of optimistic, pessimistic and most likely scenarios was used to reduce the danger of anchoring-and-adjustment bias in the estimating process. Outputs from the estimating process included a detailed worksheet for each main input item, like Table 2, containing a summary of the most significant variations that might affect it and three-point estimates of the potential range or variations. Selected sources of variation are summarised in Table 3.
Table 2: Risk identification and estimating worksheet
|
Item |
Area |
Selected sources of variation |
|---|---|---|
|
1 |
Economy |
Economic instability, inflation, exchange rates, gold price |
|
2 |
Exploration |
Funding for exploration, drilling approvals, ore grades, pit dimensions, underground access |
|
3 |
Funding |
Owners funding for operations |
|
4 |
Labour & contracts |
Labour rates, contractor costs and performance, skills, labour productivity, overtime, turnover and morale, safety |
|
5 |
Ore |
Ore type, grade, metallurgy, volumes, contaminants, suitability for milling, sulphur content |
|
6 |
Plant & equipment |
Plant and equipment rates, utilisation, productivity, maintenance, major failure, operational problems, circuit control |
|
7 |
Plant inputs |
Consumables, consumables costs, reagent, cyanide, lime, power costs, power supply, water costs, water supply |
|
8 |
Regulation |
Environmental compliance, tailings management, dust, fumes, noise, native title |
|
9 |
Underground |
Mining method, stopes, mining operations, geological model |
|
10 |
Management |
Planning, scheduling, planning staff |
Risk modelling
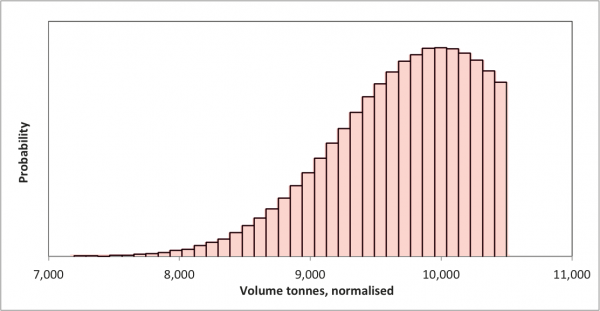
For each model input, the estimating process generated a three-point estimate (B, L, W) corresponding to the optimistic (Best, B), likely (L) and pessimistic (Worst, W) scenarios. The estimate was interpreted as defining a smooth-curve distribution, over the range between B and W, with the main part of the distribution close to the peak at L.
Specifically, in most cases, the distribution used was a Normal distribution with mean L and standard deviation equal to one sixth of the range between B and W, truncated at B and W. An example for the variation in the volume of ore milled in sulphide circuit SC-01, where the three points are (6000, 10000, 10500), is shown in Figure 2. The distribution is shown here in histogram density form, and the numerical values have been adjusted slightly for publication. The assumption about the mean value sets the peak at the most likely value L. The assumption about the standard deviation has the effect of reducing the area in the tail of the distribution; in other words, an extreme value close to the minimum value is very unlikely. (Note that we have used other distribution assumptions in other cases. This particular set of assumptions suited the client and the circumstances for this LMP.)
For the technically minded, the @Risk package was used to model the distributions within the Excel model. The truncated Normal distribution was represented by a cell function of the form
= RiskTnormal ( L, (W-B)/6, B, W ).
Figure 2: Sulphide circuit SC-01 mill throughput
To incorporate the distributions in the risk model, each distribution was normalised or ‘de-scaled’ by dividing by its mean value L. This had the advantage that the variation distributions did not have to be estimated in the same units as those in the model. The normalised distribution was then multiplied by the base value for the corresponding input for the base year, derived from the larger LMP model, to generate a distribution for the input in the base year.
The managers providing the distribution estimates were asked how the range of outcomes might change over the life of the mine, but no one identified any changes of this kind and we assumed consistent variations through time. The same normalised distribution was multiplied by the base values for the other years over the horizon of the LMP, to generate distributions for the inputs in those years. The assumption is that the variation in each input is the same, in percentage terms, over the life of the mine and the LMP.
Sources of information for risk variations and base values were recorded to facilitate validation and testing of assumptions.
Dependence assumptions
The volume of ore processed by sulphide circuit SC-01 and its average head grade are inversely related for large changes in volume, linked to major expansion of mill capacity. For marginal changes, volume and head grade are effectively independent.
The volumes of ore processed by sulphide circuit SC-01 and the roaster are positively related. Based on current experience, the observed sulphur content is relatively stable, so an increase in SC-01 throughput is reflected in an increase in roaster throughput, but this relationship may change in future. A correlation of 0.8 was assumed in the model.
Utilities costs are a component of the fixed and variable costs of the milling circuits and of the underground mining costs. They are an insignificant component of open pit mining costs. The variation in utilities costs induces a small positive correlation between these items, but this was so small that it was not included in the model.
No year-to-year correlation was included except for depreciation and amortisation, where a correlation of 0.8 was assumed.
No other sources of significant correlation were identified.
Initial results
The package @Risk was used to simulate the effects of the risk variations on the main outputs required for making decisions. The diagrams show the kinds of outputs that were obtained when information from the physicals analysis for the base year was included in the model.
Figure 3 shows the net present value of the mine's cash flows in density histogram form, normalised for commercial reasons. Figure 4 shows the same information in cumulative form, from which it is possible to determine the probability of achieving any specified NPV target value – as the target increases, the chance of attaining it decreases.
Figure 3: Net present value, in density form
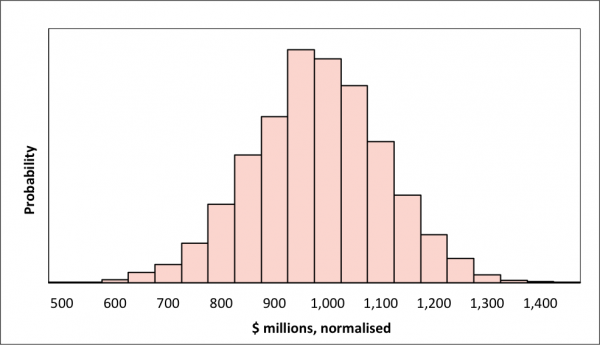
Figure 4: Net present value, in cumulative form
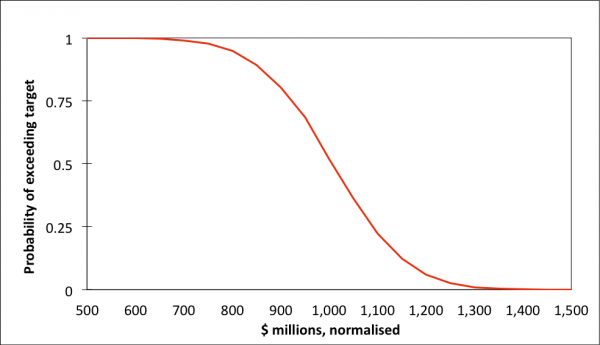
Figure 5 shows the main drivers for the operating cost per ounce, in the form of a tornado graph. The graph shows the correlations on the horizontal between the input distributions on the vertical axis and the simulated distribution of operating cost per ounce. Positive values indicate the distributions move in the same direction (both positive or both negative), while negative values indicate an inverse relationship. The main drivers for operating cost per ounce are the volume of ore milled in the SC-01 circuit and the associated head grade, with operating cost per ounce reducing as throughput and head grade increase, an inverse relationship as indicated by the negative correlations. Other aspects of the processing circuits are also important. Overall, mining costs seem relatively minor drivers of operating costs for this operation.
Figure 5: Sensitivity tornado for operating cost per ounce
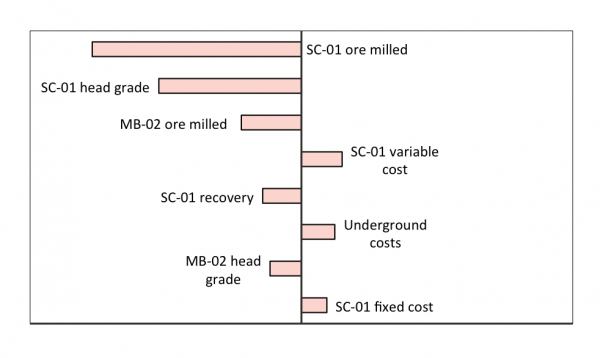
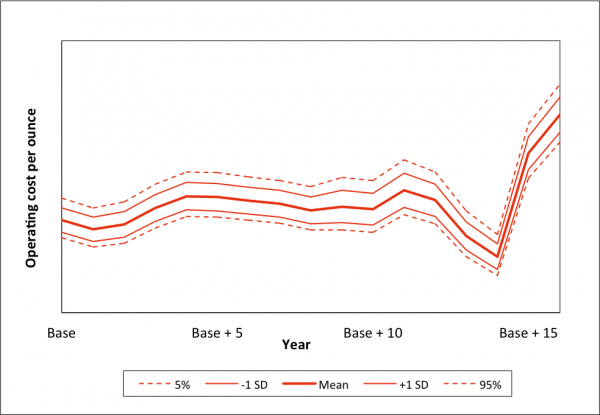
Figure 6 shows how annual operating cost per ounce varies through the life of the mine plan, with the ranges of uncertainty for each year. The increase in costs in later years is associated with the changing characteristics of the ore available as mining progresses through the ore body.
Figure 6: Trend through time in operating cost per ounce
Extensions
The initial analysis was concerned with ‘routine’ risks and variations, although some of the pessimistic scenarios included extreme risks. Some discussions were held concerning:
• Long-term issues and ‘non-standard’ risks • Strategic options that might alter the structure of the development proposal.
Issues that were considered are shown in Table 4 and Table 5. The closure of D-North noted in Table 5 was modelled as a probability tree structure linked to minable reserves. This had relatively little impact on the mine plan. Global issues that were discussed in outline only are shown in Table 6.
|
Issue |
Discussion |
|---|---|
|
Review of sulphide circuit SC-01:
Contaminated ore |
There may be a reduction in recovery as throughput increases, and an increase in the variability of recovery due to the increased difficulty in identifying problems. This issue was to be discussed further. |
|
Alternative to roasting for sulphides |
This was not considered likely in the near term, and alternative technology was not included in the budgets. |
|
Regulatory changes |
None were anticipated. |
|
Retention of mill MB-04 beyond the base year plus 2 |
MB-04 would be closed as planned if the SC-01 de-bottlenecking was successful. |
|
Introduction of heap leaching |
This was likely within 2 years. It would add 0.1 g/t to the SC-01 sulphide head grade on introduction, with the same variation distribution. It would add xxx oz/year to production, at an average cost of $yyy/oz, starting a year after introduction. |
|
Issue |
Discussion |
|---|---|
|
Closure of mine area D-North |
The life of the D-North mine was likely to be extended as reserves increase:
|
|
Long-term haulage methods for the open pit |
The option of capital investment to maintain low operating costs was to be discussed further. |
|
Change to the LMP |
An extension to mine life was likely. |
|
Area C-East underground development |
This might occur in 5 to 6 years, but it would have little impact. |
|
Issue |
Discussion |
|---|---|
|
Major changes in the gold price |
The concession owners treated this outside the main LMP. For the operator, the gold price assumption for the LMP was specified by the owners' treasury function, as it depended on the combined forward sales hedging position of the consortium. |
|
Imposition of a gold tax or gold royalty |
This was considered to be very unlikely. |
|
Title claims from indigenous owners |
The mine areas were well established, and a good relationship existed with the indigenous owners. No claims were anticipated. |
|
Changes in development area and fuel rebates |
Changes to development and fuel rebates were possible but unlikely. The owners had held discussions with Government, taxation and regulatory agencies and no immediate impacts were anticipated. |
Lessons
The model developed a set of outputs that were important inputs to planning for both the operator and the owners. Plans that depended to a greater or lesser extent on the LMP included:
- Capital investment plans for the operator
- Long-term capital structure and funding analysis for the owners
- Hedging strategies for the owners and their treasury functions.
There were significant additional benefits for the participants in the risk analysis too. By requiring the development of scenarios with quantitative estimates of the main operating parameters of the mine and mills, the modelling exercise forced managers to think in detail and with some numerical precision about their areas of responsibility. They had to do this as a group and reconcile their individual views with those of their peers. This had some interesting and, for the participants, unexpected benefits.
Managers' awareness of their own areas was enhanced, as was their understanding of the relationships of different parts of the operation to the overall operating outcome. Of course, they were all experienced managers and they had a high level of implicit understanding in any case, but they commented that the focus on numbers provided additional insights and a different perspective that they found valuable.
By considering responses to potential variations in the scenario-development process, managers started to think more explicitly about the value of flexibility in their operating areas. In particular, their individual plans reflected additional measures designed to position their areas for greater responsiveness when confronted by unexpected variability and change. Overall, senior management found that the combined effects of these revisions to individual plans and the associated discussions contributed a lot to greater strategic organisational preparedness.
The sponsor for this risk analysis reported a significant cultural change as a direct consequence of this exercise. Managers who had initially been cynical about the value of a supposedly 'theoretical' activity developed an appreciation of the detailed operational base on which the models were constructed and the additional insights that were generated. One in particular became a strong advocate for the risk management approach – from an initial negative position, he became a champion for the introduction of targeted quantitative analyses for other aspects of mine development and expansion planning.
- Client:
- Owners and operator of a gold mining concession
- Sector:
- Mining and minerals processing
- Services included:
- Quantitative modelling