Spatial modelling of pandemic influenza
Overview
This case outlines the development of a powerful and flexible simulation environment for modelling epidemic and pandemic influenza, aimed at helping policy makers explore a range of scenarios and interventions for the control of an outbreak.
The Australian Biosecurity Cooperative Research Centre (AB-CRC) for Emerging Infectious Disease funded the project. It was led by epidemiologist Dr Sam Beckett, at the time an Associate Director of Broadleaf. The project brought together expertise on spatial disease modelling, public health and social networks to study the spread and control of pandemic influenza in an Australian urban population setting.
The model allows public health epidemiologists and disease managers to study the spread of disease in an urban population, evaluate ways of limiting virus transmission, and examine strategies for avoiding an exponential explosion in cases that would overwhelm public health resources, hospitals and health services.
While not the primary focus of this project, the model could be extended relatively easily to infectious diseases other than pandemic influenza.
Introduction
Influenza pandemics
The World Health Organisation warned many years ago that pandemic influenza is an ongoing global threat from which no country is immune, and that the preventive actions required are a shared responsibility of the entire international community.
Pandemic influenza occurs when the antigenic determinants of an influenza A virus ‘shift’ sufficiently for it to appear novel to a population, or a large majority of a population. Antigenic shifts can result from genetic mutation, or from the hybrid reassortment of fragments from different viruses within a single host cell. Avian and mammalian viruses can combine during replication within a single cell, resulting in a virus that contains elements of both. This novel virus can then undergo relatively minor drift mutations to enable it to become transmissible amongst humans and thus a potentially pandemic strain.
Such antigenic shifts occurred in 1918/19 and led to the devastating Spanish Influenza H1N1 pandemic, and similar shifts have resulted in recent pandemics, including the Asian Influenza H2N2 pandemic of 1957/58, the Hong Kong H3N2 pandemic of 1968/69 and several others, most recently the Covid-19 pandemic of 2019/20.
In the light of ongoing (now heightened) global pandemic threats, countries worldwide have revised their pandemic response plans and administrative arrangements.
Genesis of this project
The AUSFLU Project arose as a result of increased awareness of the pandemic threat. It was a collaborative endeavour, with partners in the Australian and NSW Governments, the University of Melbourne and Curtin University of Technology, funded by the AB-CRC for Emerging Infectious Disease. The aim was to develop a tool to help public health policy researchers to evaluate strategies for pandemic planning and response.
The AUSFLU models
AUSFLU accommodates a range of approaches for simulating the process of infectious contact and disease transmission. They form a suite of stochastic, discrete-time models that track individuals as they transition through specific states. There are several simulation components:
- A simple non-spatial homogeneous mixing model that focuses on the contact opportunities of each infectious individual
- A simple spatial model that selects contacts according to their spatial location within the population
- A complex spatial model that includes 30 major disease transmission ‘pathways’ that correlate loosely with the contact settings that individuals in an urban population will typically face at work or leisure
- A non-propagating epidemic model that maps the exposure opportunities of susceptible individuals at key mixing places, rather than the contact and transmission opportunities of infectious individuals
- A social contact networks model.
AUSFLU’s strength lies in the fact that all of these models use a common, peer-reviewed set of disease and response parameters, and a single population data structure. This allows users to choose according to their requirements, and to run comparative analyses to investigate the impact of additional complexity or specificity.
AUSFLU was developed entirely within a Geographic Information System (GIS) environment using MapBasic. The AUSFLU model runs in MapInfo.
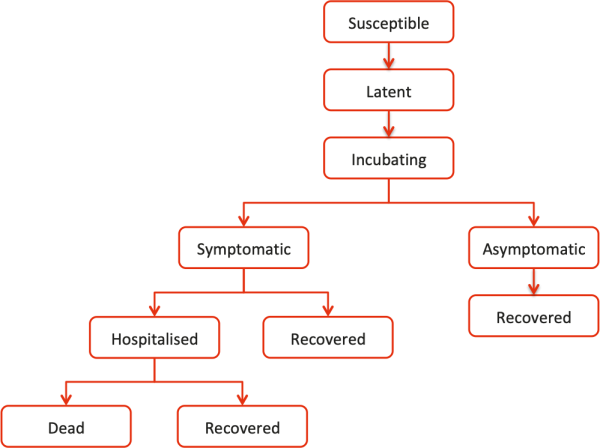
All of the models operate on a state-transition framework that includes separate states for susceptible, latently infected, incubating, asymptomatically affected, symptomatically affected, hospitalised, recovered and deceased individuals (Figure 1).
Figure 1: Disease states for individuals
Inputs to the models can be configured and customised to allow for:
- Initial and subsequent ‘seeding’ of disease
- The pathogenicity of the pandemic strain
- Disease transmission pathways
- Age groups and their characteristics, including the proportion of infected individuals in each age group that will become symptomatic, the proportion of these that will be hospitalised, the mean period of hospitalisation and proportion of hospitalised patients that will die from the disease
- Age-specific pre-pandemic immunity
- Mean and maximum latent, incubation and symptomatic periods for individual age groups
- The relative infectiousness of individuals in each infectious state for individual age groups
- Antigenic drift and the evolution of new strains of virus at specified intervals.
Default base-case inputs for pathogenicity and disease periods were drawn from the relevant medical and scientific literature. They can be customised when starting the models.
The models can also be configured to incorporate intervention strategies:
- Social distancing
- Forward and backward tracing
- Anti-viral treatment
- Pre- and post-exposure prophylaxis
- The use of candidate and customised vaccines.
Model population
AUSFLU was developed using population data for the urban centre of Tamworth, a regional town of approximately 35,000 in northwest New South Wales, Australia. Tamworth was selected as it is a self-contained regional centre, providing core facilities for neighbouring towns. It is reasonably typical of larger Australian rural centres in its breadth of cultural, demographic and socioeconomic groups.
The model population was geo-located by household and distributed according to Tamworth’s suburban population. This synthetic population was faithful to the Tamworth’s population demography and workforce from the most recent census, and its housing, education, health and aged care facilities.
Census data was supplemented with more detailed data collection activities to look more closely at how the Tamworth population interacts on a daily basis.
- More specific statistical surveys about early childhood care, healthcare services and health seeking behaviour, and workplace sizes and work routines
- Interviews with administrators in each of Tamworth’s day-care centres, schools, aged care centres and hospitals to establish the spatial distribution of their patrons and workforce and to better understand how individuals mixed within each facility
- A survey of 967 households to look at daily routines and contact opportunities, including daily activity checklists and contact diaries.
Although care should be taken when drawing inferences about contact behaviour in other regional Australian urban populations from this single study of Tamworth, general trends are likely to be reasonably representative. Nevertheless, the models can accommodate spatial population datasets and contact parameters for a town of up to 200,000 individuals, to allow comparisons between different regional centres and with other models for pandemic influenza.
Model outputs
AUSFLU generates tabular, mapped and graphed outputs that take full advantage of the capabilities of the GIS modelling environment.
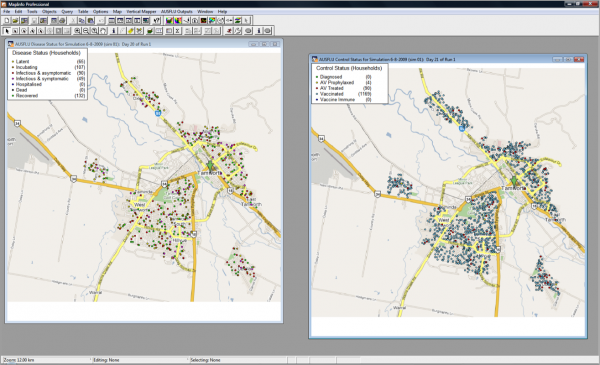
Daily disease and control maps track the progress of influenza through the model community and the implementation of interventions (Figure 2).
Figure 2: Disease and control maps
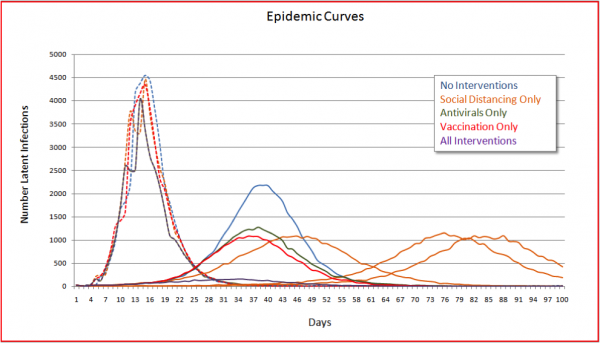
Epidemic curves show that show pictorially when the outbreak is peaking and when it is moving into decline, and illustrate whether interventions flatten the epidemic curves or may prolong an outbreak (Figure 3).
Figure 3: Epidemic curves, new infections
Day-by-day summaries show:
- Individuals in each disease and control state, from which epidemic curves and daily disease event plots can be generated
- Each exposure event, including when and where it occurred, and by which pathway; whether transmission occurred; and whether the exposure event has been traced
- Pathway-specific incidence rates and relative risks
- Simulation statistics (minimum, maximum, percentiles, mean and variance) for key disease and control outcomes.
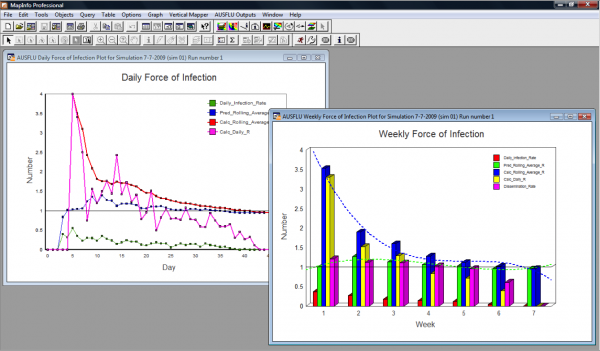
Daily and weekly ‘force of infection’ plots illustrate how the reproduction number changes through the course of the outbreak and the effect of disease clustering (Figure 4).
Figure 4: Force of infection
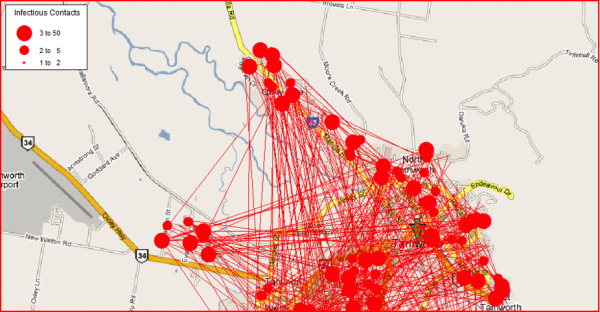
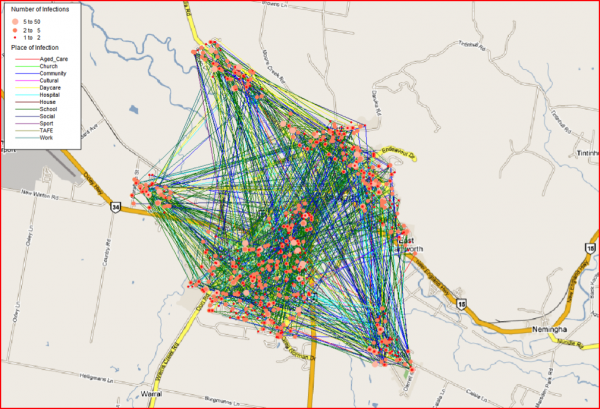
Spider plots show the spatial connectivity of individuals and the impact of key transmission settings and pathways (Figure 5).
Figure 5: Spatial spider plot
Lessons
Simple and complex models
To be applicable to a range of scenarios, the modelling tool needed to be flexible, and to accommodate both simple and complex modelling frameworks.
The simple models in this case were designed to replicate the assumptions of most mathematical models, operating with low complexity, few assumptions, and parameters that could be established without undue controversy. They provided for assessments of relatively generalised policy issues.
The more complex models in this case rested on substantially more assumptions and parameters. Their advantage was that they could be configured to examine very detailed research questions.
The spatial elements of disease spread and control were incorporated into both the simple and complex models.
In most circumstances we prefer to start with simple models that provide initial results quickly. Then, by highlighting the areas of greatest uncertainty in the simple models, complexity can be introduced where it will provide most value. This reflects what Chapman (2019) calls ‘clarity efficiency’: the need for a balance between the amount of effort that is devoted to exploring important decisions (with the context and uncertainty that surrounds them) and the understanding that is generated for those who must make those decisions.
Population diversity and contacts
This study showed that population diversity and contact structures can substantially influence the character of a potential epidemic, and the effectiveness of interventions such as social distancing, antiviral treatment, prophylaxis and vaccination.
The magnitude and direction of the particular effects that were observed reflected the aggressive nature of the simulated outbreak and the rapid penetration of key contact structures. The spatial models, and the spatial plots they generated, provided insights into those characteristics of the population and its contact networks that were likely to be important for targeting interventions effectively.
Intervention strategies
The common population dataset and the core set of disease and intervention parameters provided substantial internal consistency across the individual models. Comparative studies of the efficacy of different intervention strategies could be carried out simply and easily, within a powerful and flexible modelling environment.
Seven intervention scenarios were chosen for the study: social distancing, tracing, antivirals treatment, pre- and post-exposure prophylaxis, and candidate and customised vaccines. The figures above illustrate the extent to which the models can be tailored to allow users to explore a wide range of additional research questions.
The specific conclusions about the efficacy of the intervention scenarios, when compared with the ‘no interventions’ baseline, were not remarkable. We chose an aggressive, highly pathogenic and highly transmissible strain of influenza virus as the basis for the study, which colour the relative efficacy of the different interventions, so it would be unwise to generalise them to other contexts.
Nevertheless, the scenarios helped to elucidate a range of matters that are important for modelling pandemic influenza. In particular, they illustrated how spatial visualisations of the spread of infections can assist in understanding and evaluating interventions in greater detail than might be possible with standard mathematical epidemiological models.
Acknowledgement
This work would not have been possible without the support of the AB-CRC for Emerging Infectious Disease.
- Client:
- Australian Biosecurity Cooperative Research Centre (AB-CRC) for Emerging Infectious Disease
- Sector:
- Health, pharmaceuticals and biotechnology
- Public sector and government business
- Agriculture, biosecurity and the environment