Post-investment review of an oil and gas development
Overview
We were asked to assist in the post-investment review (PIR) of a large oil and gas development. Our client had a corporate requirement for reviewing completed projects within the first two years after completion, to understand how the investment performed in relation to the expectations set at the time it was approved.
The PIR involved an internal team separate from the team who managed the investment. The PIR was focused on the factors impacting on the investment’s authorised key performance indicators (KPIs), and in particular the economic evaluation. The team was tasked to make an assessment of what went well and what could be improved in future, and to present its findings to senior management. It was intended to be a corporate learning exercise.
The team had collected and reviewed a mass of documents about the investment and its outcomes as well as undertaking economic and technical analyses. It had conducted a series of interviews with senior managers associated with the investment. We were asked to facilitate a root cause analysis (RCA) workshop with the PIR team that would draw together the outcomes from the document reviews, the analyses and the interviews.
This exercise was not about apportioning blame. The intention was to identify root causes, from which actions could be developed that would allow investments to be done better next time, either by exploiting the company’s strengths and the things that were done well, or by avoiding the circumstances that led to shortfalls in performance and outcomes.
Background
The company was a junior partner in a consortium that had made a large investment in an oil and gas development. A prime contractor had been engaged for the majority of the development, although the company’s drilling division was closely involved in drilling operations. The company insisted on taking the role of operator of the field, primarily so it would have more control over the investment and its capital cost.
The work described here took place about two years after the first oil was produced.
Analysis process
Data collection
The PIR team conducted interviews with people in the company’s investment team, the joint venture partner, the prime contractor for the development and operations personnel. A structured approach was followed, with a general set of questions to be used for all interviews and a more technical set, tailored for the functional specialty of the interviewee, for specific interviews.
Topics covered in the general questionnaire included:
- Strategic context
- Investment sponsorship and direction
- Partners and contractors
- People and individual capability
- Organisation and corporate capability
- Performance achieved.
Project records and technical evaluations, including analyses of economic and production performance, supplemented the interviews.
Approach
At the time we became involved, the team had accumulated a large collection of material from which they had extracted many facts. Our job was to help them step back from the mass of detail in which they had become immersed and work with them to structure the lessons. Root cause analysis was the preferred way of doing this.
The steps in a simple root cause analysis process for examining a single success or a failure are outlined in Figure 1. The steps were modified slightly for this case.
Figure 1: Root cause analysis steps
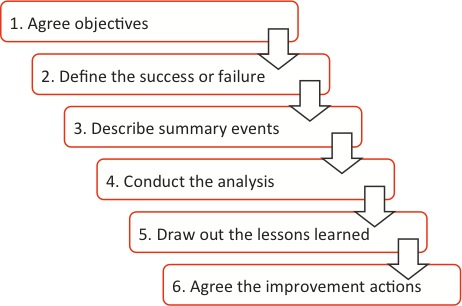
Cause and effect trees were the preferred form of analysis in step 4. A cause and effect tree takes some effort to create (more than involved in techniques like fishbone or Ishekawa analysis, for example), but it allows lessons learned to be extracted readily (step 5), from which improvement actions can be derived (step 6).
Parts of the process used for this PIR differed slightly from a ‘standard’ RCA like that in Figure 1.
- In step 2 there were no successes or failures related to single ‘events’ in the usual sense, that is identified in the form of individual incidents that led to performance outcomes. The company was interested in the performance of the investment in terms of specific KPIs, agreed at the time of investment approval and reviewed after operations had started. In consequence, the usual form of definition of a success or failure in step 2 – What happened, where and when? – was adjusted to reflect the revised and more general view of an event. The ‘what’ part of the event definition was related explicitly to the KPI being considered, and in all but a few cases the ‘where’ and ‘when’ related to the whole investment from approval (project sanction), through the execution phase and into the operating phase, up to the time the PIR was conducted.
- Because successes and failures were described in general terms, the causes were often related more to an accumulation of general factors than to discrete events.
- The scope and scale of the investment were large, so some of the causes or performance drivers that related directly to performance outcomes were quite complex in their own right and they were separated for independent RCAs. This was a matter of convenience, as it allowed the team to focus on smaller cause and effect trees.
Workshop preparation
We constructed initial cause and effect trees before the workshop, in a number of steps.
- We reviewed the documents, analyses and interview notes and extracted what seemed to be important facts, intermediate actions and preconditions. We recorded each fact on a separate Post-it® note, and documented its source.
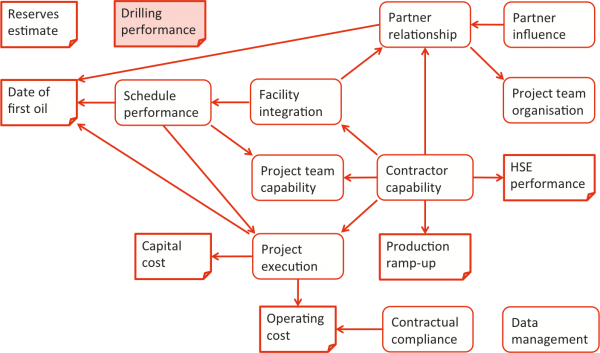
- On large sheets of paper, we grouped the facts into related topic areas. Some of them related directly to performance outcomes and what appeared to be their direct causes. Others were related to indirect or intermediate causes that were more general drivers for those outcomes. They are shown in Figure 2: the outcomes are shown in document boxes, and the intermediate causes are in rounded rectangles, with arrows showing the main cause-effect linkages.
- Within each group relating to performance outcomes or intermediate causes, we developed initial draft cause and effect trees as starting points for the workshop.
- No drilling performance target was set at project approval, but there were corporate KPIs for drilling. The reasons for the success of the drilling campaign, the lessons and the associated improvement actions were examined in a separate technical analysis undertaken by specialists from the drilling division and reported separately. Drilling was included in Figure 2 for completeness.
- One matter that was not a direct cause, relating to data management, was added, as the team felt there were important lessons and improvements for the company.
Figure 2: Performance outcomes and causes
Workshop process
The workshop with the PIR team concentrated on steps 4 and 5 in Figure 1. For each topic in Figure 2, the team:
- Reviewed the initial cause and effect tree
- Adjusted the wordings of the facts where necessary (usually because we had not understood fully the documents or interview notes from which we had extracted them before the workshop)
- Inserted new facts, intermediate actions or preconditions
- Reviewed and revised the cause and effect linkages
- Agreed the main lessons
- Agreed the main actions that would lead to improvements.
The workshop used the original sheets of paper and Post-it® notes, and the new notes. The notes were rearranged into cause and effect chains. After each topic had been completed, we took a photo of the sheet to prevent loss of information if notes dropped off the paper.
We collected the sheets (and the photos) and documented the cause and effect trees in special-purpose software. The PIR team reviewed the outcomes before they were published.
Workshop outcomes
Overview
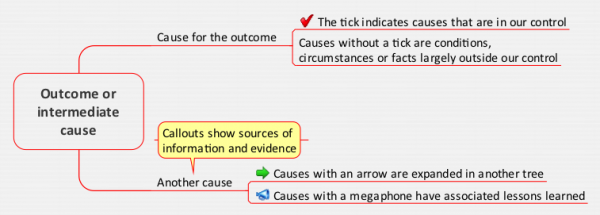
The following sections show the cause and effect trees for some of the topics in Figure 2, the lessons learned and the recommended actions. Figure 3 shows the notation used in the cause and effect trees. (For confidentiality reasons, callouts showing sources of information and evidence have been omitted from the detailed trees presented later.)
Figure 3: Notation used in cause and effect trees
The diagram in Figure 2 shows the topics, with the arrows indicating the primary causation links. There are several features that are of interest.
- The reserves estimate and the excellent drilling performance were stand-alone events, largely independent of the other matters.
- Weaknesses in the processes that led to the selection of the contractor, a contractor that turned out to be clearly inadequate technically, were causes for many of the performance shortfalls in construction and operation. There were many compounding causes, but poor contractor performance seemed to lie at the heart of the problems with timing and HSE performance in particular.
- The consortium partner’s influence on the investment and the company’s position as a minority operator were linked to delay, but not to capital cost. The company took the role of minority operator to maintain control of development costs, and this appeared to have been a relatively successful approach.
- Despite their prominence in the interviews with participants, the organisational structure and capabilities of the investment team do not appear to have been drivers for any of the investment KPIs, although they had other significant impacts on the company and its people.
A selection of the cause and effect trees relating to individual performance outcomes and intermediate causes is shown below, as well as the main lessons and recommended actions.
Health, safety and environment
HSE performance was mixed and the investment failed to meet its targets. The analysis in Figure 4 was used to derive the four main lessons and actions in Table 1.
Figure 4: HSE performance

|
Lesson |
Recommended actions |
|---|---|
|
We did not provide adequate HSE resources early enough |
Appoint HSE personnel at an early stage |
|
We did not understand the full cost of our HSE processes |
Ensure adequate HSE resources are costed into the estimate |
|
Only lagging KPIs for HSE were used |
Set realistic and proactive KPIs, not just lagging indicators |
|
The contractor did not meet the HSE technical specifications |
Include HSE requirements in tender documents and in the technical evaluation criteria for selecting contractors |
Organisational structure
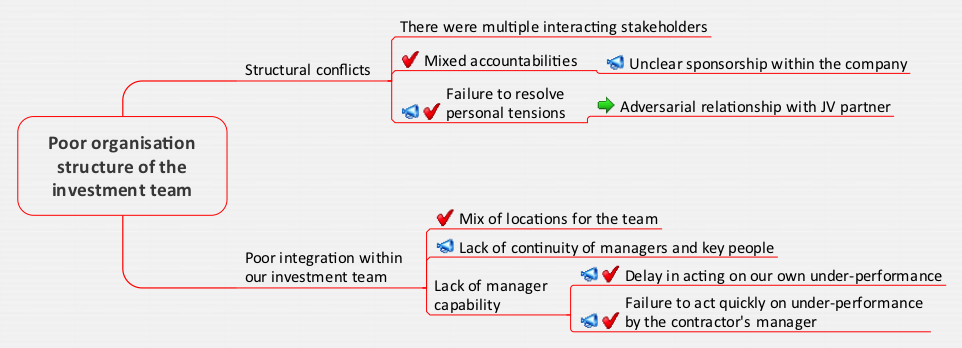
There were weaknesses in the way the team was organised and managed. Although they did not seem to affect investment performance, they affected team morale.
Figure 5: Organisation of the investment team
|
Lesson |
Recommended actions |
|---|---|
|
There was unclear sponsorship for the investment within the company |
Ensure there is single-point sponsorship for investments |
|
Personal problems were not resolved quickly |
Ensure personal tensions are resolved by providing a formal mechanism for resolving conflicts |
|
There was a lack of continuity of managers and key people |
Maintain continuity of the project manager and key people where possible |
|
We did not act on our own under-performance quickly We did not act on the contractor’s under-performance quickly |
Expand the remit of the Project Steering Group (PSG) to ensure shortcomings in the capabilities of managers (in all relevant organisations) are identified and resolved quickly Implement the new process whereby the PSG signs off on all senior manager appointments |
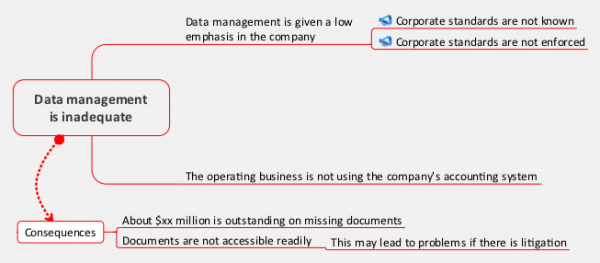
Data management
Poor document management was observed during the PIR. Although this was not related directly to a performance outcome, the PIR team thought it was worth examining with a view to improving corporate outcomes more generally.
Figure 6: Data management shortcomings
|
Lesson |
Recommended actions |
|---|---|
|
Corporate standards are not known |
Create a document management and retention process early in the life of an investment |
|
Corporate standards are not enforced |
Include document standards as enforceable requirements in contracts |
Lessons
A PIR for a major investment must have good data if it is to be successful. The PIR team collected and analysed a great deal of data and they interviewed widely. They were systematic about their tasks, and they focussed on facts rather than conjectures. This provided an excellent base for the RCA activities.
We did a large amount of preparation before the RCA workshop. We extracted facts from the material collected by the team, prepared initial cause and effect trees, structured the agenda, issued briefing material and ensured the workshop venue was suitable for the task. All this is basic good practice for the conduct of a workshop.
Post-it® notes and paper were ideal for a workshop like this.
- They were very flexible, for creating the initial groupings of facts, for generating the initial cause and effect trees and for the workshop itself.
- Their use encouraged the entire team to get involved. Members of the team were standing up, filling in new notes, moving notes around, examining relationships between causes and effects and actively exploring the structure of what went on in the investment. The team was very committed to start with, and the workshop mechanisms harnessed their enthusiasm in a structured way.
- However, it is always wise to take photographs of the sheets, to prevent information being lost when the sheets are moved from the workshop venue to the office for transcription. Despite our care, we found several loose notes when we reviewed the sheets, and we were very pleased we had the photographic backup. Modern smart phones make this very easy.
We transcribed the paper sheets into widely used commercial RCA software for reporting the workshop outcomes. The software tool we chose proved to be a poor choice, as it was too inflexible: it forced a specific structure on the cause and effect trees, it imposed restrictions on the number of words that could be used to describe an event or a cause, and there were limitations on the way in which facts or assertions could be annotated to record the sources of evidence. We now employ more flexible software for cause and effect trees, particularly MindManager, which was used to generate the diagrams in this case study.
The PIR team had done a great investigative job, and the RCA was a useful way of drawing the strands together. The outcomes from the RCA provided a valuable contribution to the final PIR report.
- Client:
- International oil and gas company
- Sector:
- Oil and gas
- Services included:
- Independent review
- Root cause analysis
- Project risk management