Coal to urea plant construction bid
Introduction
This case illustrates a simple quantitative analysis of uncertainty, undertaken over a period of a few days. It was conducted for an engineering design and construction company to support its commercial bid for a set of work packages associated with a large coal to urea plant.
It provided a sound understanding of the assumptions and uncertainties associated with the work, a basis for the commercial team to plan their negotiating approach as they finalised their formal tender response, and a valuable input to the commercial decision about the price at which to pitch the bid.
Background
The coal to urea process
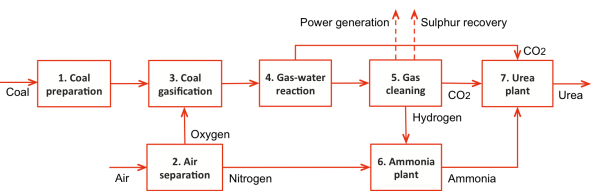
The process by which urea is produced from coal is outlined in Figure 1:
- Coal is pulverised and dried, to enhance its conversion efficiency
- The air separation unit (ASU) separates air into oxygen and nitrogen
- The pulverised coal and oxygen from the ASU are converted in a catalytic reaction in the gasifier into synthetic gas (syngas), a mixture of hydrogen and carbon monoxide in proportions that depend on the catalyst and the operating conditions
- The carbon monoxide in the syngas is reacted with water to produce carbon dioxide and hydrogen, increasing the proportion of hydrogen
- The gas is cleaned to remove impurities and particulates and then separated; hydrogen is used for ammonia production, carbon dioxide is used for urea production and the cleaned syngas is used for power generation
- Nitrogen from the ASU and hydrogen from the gas cleaner are combined to produce ammonia, in the catalytic reaction 3H2 + N2 → 2NH3
- Ammonia and carbon dioxide are combined to produce liquid urea, in the reaction 2NH3 + CO2 → (NH2)2CO + H2O
- Liquid urea is usually dried and shipped in granular form.
Figure 1: Coal to urea process flow diagram
The main components of the process in Figure 1 use well-proven technology, for which there are multiple suppliers. They are regarded as posing relatively low risk.
The requirement
An engineering, procurement and construction (EPC) contractor had been appointed for the project and international companies had been selected for the main processing packages. We were advising an engineering design and construction company that intended to bid for selected supporting packages, including electrical and instrumentation works, and structural, mechanical and piping engineering, fabrication and installation. The EPC contractor required bids for individual packages of work.
Our client wanted to understand what uncertainties might affect the work and the cost of completing it, to be able to set realistic bid prices for the designated packages that took proper account of risk.
Quantitative analysis
Sources of uncertainty
Qualitative risk assessments had been conducted on each package and the plant was considered to pose relatively few risks for the company.
The main sources of uncertainty had been identified as:
- Labour hours, related to both scope and productivity
- Labour rates
- Material quantities and rates
- Plant and equipment hours and rates
- Project management and supervision
- Escalation.
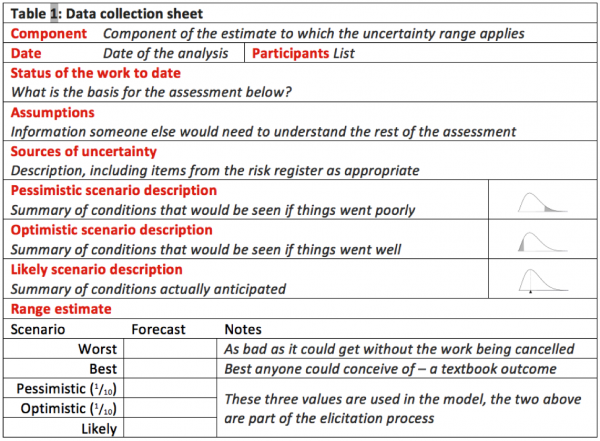
Estimates of the effects of the sources of uncertainty on the cost of each package were developed in a workshop, in the form of ranges. Individual range estimates were collected using templates like the one in Figure 2.
Figure 2: Data collection template
Quantitative outcomes
The cost estimates for the work packages were represented in simple Excel spreadsheets in which the main drivers of uncertainty noted above were modelled explicitly as percentage variations from the basis of estimate. The range estimates from the workshop were included in the spreadsheets as distributions, using the modelling add-in @RISK. Package sizes varied from USD 25 million to USD 200 million; all estimates have been normalised here to a base of 100.
Distributions of the estimates for each work package were developed using the Monte Carlo simulation capabilities of @RISK. Figure 3 shows an example for one of the packages, in cumulative form. The graph illustrates the chance that the actual cost for the package will exceed the bid price (excluding the company’s profit margin). This allows the commercial bid to be determined according to how much risk the company is prepared to take. Alternatively, if a specific bid price is suggested or preferred for commercial reasons, it allows the associated chance that there will be an erosion of margin to be calculated.
In both situations, the analysis provides a dispassionate framework for what can be an emotionally charged decision making process. The outcome of the analysis and the supporting information, in data tables like Figure 2, enable decision makers to understand the factors at work and how they can affect the cost outcome.
Figure 3: Cost distribution for Package A
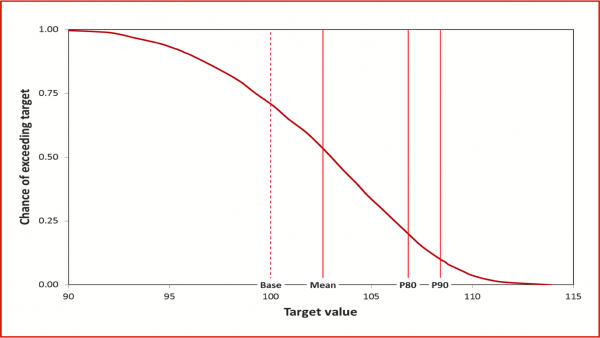
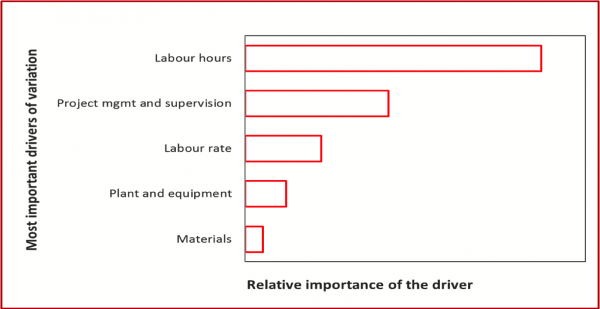
Figure 4 shows the main drivers of variability for Package B. Reducing the uncertainty in these drivers would reduce the uncertainty in the overall estimate for this package.
Figure 4: Drivers of variability for Package B
Lessons
This was a relatively simple, small-scale analysis of the cost estimate, for a relatively low-risk project. It only took a few days, with the main effort on initial structuring and quantitative modelling, and a short workshop with the project team to elicit the uncertainty ranges. Nevertheless, it provided a sound basis for the commercial team as they planned their negotiating approach.
The discussions underlying the range estimates, captured in templates like Figure 2, provided a deeper understanding of the assumptions and uncertainties associated with the work, and their implications. This helped the bid team prepare a formal tender response that would be persuasive for the EPC contractor as it assessed whether the contractor had the understanding, as well as the technical skills, necessary to deliver the outcomes that were required.
Quantitative outcomes like those in Figure 3, together with tabulated statistics for the distributions, provided a guide to the amount of contingency available for any specified commercial bid amount (after taking profit margin into account). They were a valuable input to the commercial decision about the price at which to pitch the bid.
Outcomes like those in Figure 4 help contractors in several ways:
- They indicate where scarce bid resources could be used best to reduce the uncertainty, and hence adjust the offered price, before they submit a bid
- They indicate to negotiators where they might focus their attention to determine whether the contract terms and conditions could be used or adjusted to reduce or compensate for risk that might otherwise lie with the contractor
- If the bid is successful, they provide an initial guide to where actions might be taken to reduce uncertainty, although usually more detailed risk analyses would be undertaken after contract award as well.
Quantitative analyses need not be overly complicated. The effort involved in this case was modest, yet it generated outcomes that were significantly better than the common ‘base cost plus a margin’ approach the company had used frequently when bidding in the past. The analysis did not take long, it minimised disruption to the project team, and it gave them added confidence as they finalised their commercial proposal.
- Client:
- Engineering design and construction company
- Sector:
- Mining and minerals processing
- Agriculture, biosecurity and the environment
- Oil and gas
- Services included:
- Quantitative modelling
- Cost uncertainty
- Contract support