Showing that effective risk management adds value
Summary
Introduction
We have been advising large businesses and government entities on enterprise risk management (ERM) for many years. Managers often ask us to justify why they should invest in ERM and how to demonstrate its value in measurable terms.
This guidance note distils some of the empirical evidence on the benefits an organisation should expect from an effective ERM framework and process.
Outcomes in brief
There is clear evidence that companies with risk management processes generate better financial and business outcomes than those without. There is also clear evidence that companies with higher levels of risk management maturity perform better than those with lower levels of maturity.
Caveat: correlation and causation
The empirical evidence is expressed in terms of the relationships between measures of risk management implementation and measures of company performance, usually based on financial indicators. It is important to recognise that the fact that one of these measures is strong when the other is strong does not necessarily mean that one causes the other. It might be that they are correlated rather than being in a cause-effect relationship.
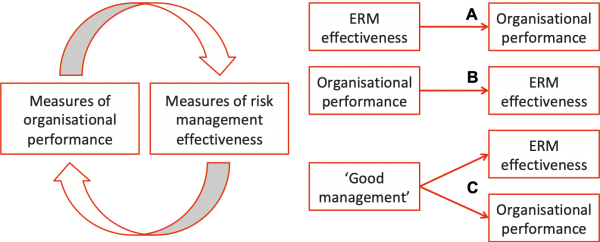
There are many reasons why there might be a correlation between ERM effectiveness and company performance (Figure 1). These relationships might, in themselves, offer a valuable guide to decision-making and management. They include:
- Strong ERM effectiveness leads to better business decisions, both to recognise and capture opportunities and to avoid problems, resulting in better business outcomes
- Organisations that perform well can afford to invest in ERM, and the better the performance the more that can be invested, leading to higher levels of ERM effectiveness
- There is another organisational factor, which we might call ‘good management’ for want of a better term, that drives both ERM effectiveness and business performance; good managers produce good business outcomes, and they also impose sound, structured management processes such as ERM
- There may be a virtuous circle that combines several of the factors noted above, whereby good ERM effectiveness drives good business outcomes, and these in turn drive additional ERM effort and improved ERM effectiveness
- Organisations that have seen benefits flow from an investment in business process improvement are more likely to have the confidence to invest in further improvement, driving a wider range of performance enhancements that will often include ERM.
- Presence or absence of ERM: Several studies have used content analysis of company annual reports, analyst reports and financial media to determine when terms like ‘risk’ were first used in relation to a company. This approach has the advantage that only publicly available information is needed.
- Risk management maturity: Many studies have used some measure of risk management maturity, often based on formal maturity assessment models. For example, Table 1 shows the attributes that are used to compile the Risk Management Maturity (RMM) score by the Risk and Insurance Managers Society (RIMS), with each attribute being aggregated from a set of related components. There are several comparable maturity models in widespread use.
- Financial metrics: Many of the metrics are based on financial indicators such as revenue, earnings before interest, tax, depreciation and amortisation (EBITDA), net profit, share price and so on. Often the specific measure is based on cumulative growth in the indicator, or its variability or volatility. Financial metrics have the advantage of relying on publicly available information, at least for listed companies.
- Survey data: Some studies have used perceived business performance based on survey information rather than pre-existing data (e.g. Annamalah et al, 2018; Gates et al, 2012).
- Value metrics: Many studies have used Tobin’s Q, sometimes called the Q ratio, as a measure of company value. Tobin’s Q is defined as the ratio of the total market value of the company divided by its total asset value, so it provides an estimate of whether the company is undervalued or overvalued. Annamalah et al (2018) used a different metric, economic value add, which is defined as net operating profit after tax, less total capital multiplied by the cost of capital; EVA = NOPAT – TC*WACC.
- 'Best-in-class’: Another strand of analysis examines ‘leading companies’, where a leading company shows better performance across a range of financial and operating measures, aggregated in some way that seems appropriate for the business sector of interest.
- Hoyt and Liebenberg (2011) showed that publicly listed insurance companies that engaged in ERM were valued roughly 20% higher than other insurers, after controlling for other determinants of value
- Correlations between ERM and performance were replicated by Kommunuri et al (2016) for 199 publicly listed companies in Vietnam and by Rodrigues da Silva et al (2019) for 77 companies listed on the Brazilian stock exchange; Rodrigues da Silva et al (2019) also noted that companies that used ERM reported less variability in value
- Quon et al (2012) found no statistically significant association between risk assessment and company performance for 156 non-financial companies listed in Toronto, but their data was derived for a time period (2007-09) that covered a major financial crisis during which the performance of companies might have been unstable for many reasons, masking the systematic effect of any particular business process.
- Unscheduled asset downtime
- Overall equipment effectiveness
- Operating margin compared to the corporate plan
- Ability to meet product launch target dates
- Ability to deliver projects on budget and on time
- Financial metrics.
Figure 1: Correlation and causation
There seems to be little empirical evidence about the specific reasons for the correlations that are observed although many people will express an opinion on the subject. This paper offers guidance on what to consider as an organisation makes up its own mind about whether to devote resources to ERM and how to go about it.
Project risk management
This note does not discuss the contribution of sound risk management processes to projects and programs. We shall address the evidence for that separately.
Sources and measures
Sources
The references section below details the source material on which we have drawn when compiling this guidance note. A summary of the sources and their findings is provided in Table 4 at the end of this note.
Measures of ERM effectiveness
The term ERM is often used loosely. The work described here is mainly concerned with organisations that have, or aspire to have, an explicit risk management focus. Several measures of ERM effectiveness have been used.
|
Attribute |
What it measures |
|---|---|
|
ERM-based approach |
Executive support within the corporate culture |
|
ERM process management |
Integration into business processes to support the reduction of uncertainty and promote exploitation of opportunities |
|
Risk appetite management |
Accountability within leadership and policy to guide decision-making regarding risk-reward tradeoffs |
|
Root cause discipline |
Linking outcomes with their sources to minimize or prevent impact of adverse outcomes and maximize value extraction from opportunities |
|
Uncovering risks |
Analysing and documenting risks and opportunities to uncover dependencies, including emerging and dynamic risks |
|
Performance management |
Executing vision, mission and strategy utilizing risk metrics as an integral element in strategy and planning activities |
|
Business resiliency and sustainability |
Integration into operational planning and execution for ability to recover quickly from setbacks and to maintain something of value |
Source: Beals et al (2015)
Measures of business performance
Those researching the value of ERM have used many measures of business performance.
Risk management and business performance
ERM and overall business performance
Several authors have shown that simply having a risk management process of some kind, based on content analysis of reports, correlates with improved business performance.
Using a measure of risk management maturity allows more refined analysis. Several studies have adopted this approach.
McShane et al (2011) observed a positive relationship for 82 publicly listed insurance companies between Standard and Poor’s ERM ratings and company performance measured by Tobin’s Q. The relationship was stronger at lower ERM ratings than for higher ratings.
Ernst & Young (2012) showed that compound annual growth rates in revenue, EBITDA and EBITDA/EV over the period 2004 to 2011 were higher for companies with the most mature risk management (Figure 2).
Figure 2: Risk maturity and financial performance
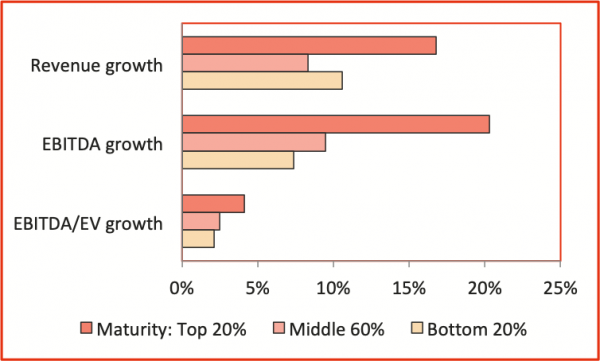
Source: Ernst & Young (2012)
FERMA (2012) found that companies with advanced ERM practices generate stronger EBITDA growth than those with weaker ERM; 28% of companies with advanced ERM had growth over 10% compared with 16% of companies with emerging practices (Figure 3); among companies with an EBITDA growth over 20%, 74% had mature or advanced risk management practices.
Figure 3: Risk maturity and EBITDA growth
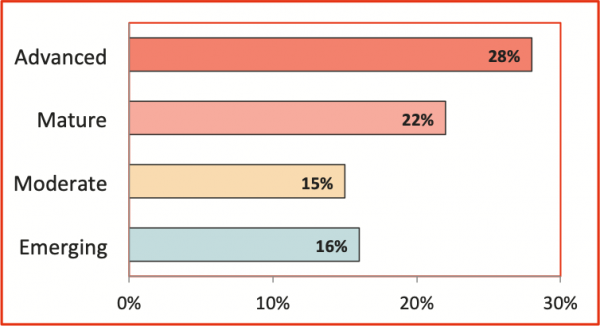
Source: FERMA (2012)
In a survey of 150 companies, Gates et al (2012) observed a significant positive correlation between perceived risk management capability and perceived business performance.
In a survey of 81 insurance brokerage clients, Aon (2017) showed that higher risk maturity scores correlated with higher stock price performance (Figure 4) and market valuation expressed as a price/earnings ratio (Figure 5).
Figure 4: Risk maturity and stock price performance
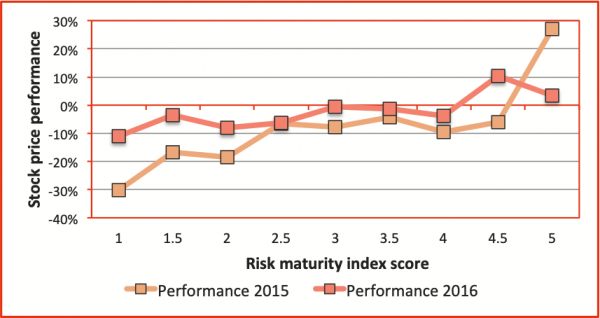
Source: Aon (2017)
Figure 5: Risk maturity and market valuation
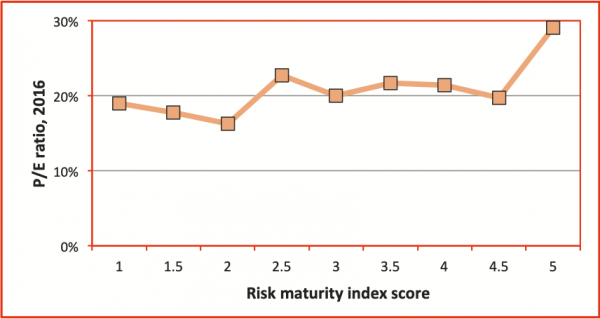
Source: Aon (2017)
In a sample of 15 oil and gas companies in Malaysia, Annamalah et al (2018) showed a significant correlation between implementation of ERM and improved business performance measured in terms of economic value add.
Farrell and Gallagher (2015) identified a strong correlation between ERM performance and financial performance. Companies in the top tiers of ERM maturity (levels 3-5) were associated with an increase in value of about 25% compared to those in the lower tiers (levels 1-2). They also identified the contributors in the Risk and Insurance Management Society (RIMS) Risk Maturity Model (RMM) that contributed most to the effect of sound ERM on company value (Figure 6, Table 1).
Figure 6: ERM contributors
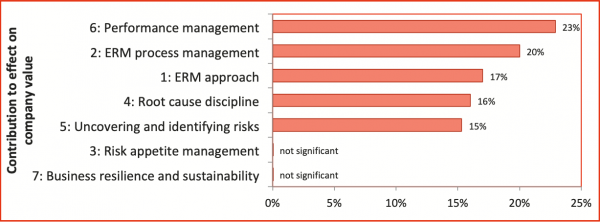
Source: Farrell and Gallagher (2015)
Risk management and performance volatility
Several studies have shown that good risk management practices are associated with more consistent financial outcomes, expressed as lower earnings volatility and lower share price volatility.
FM Global and Oxford Metrica (2010) showed that large multinational companies with strong physical risk management processes had far lower earnings volatility than those with weak practices (Figure 7).
Figure 7: Physical risk management and earnings volatility
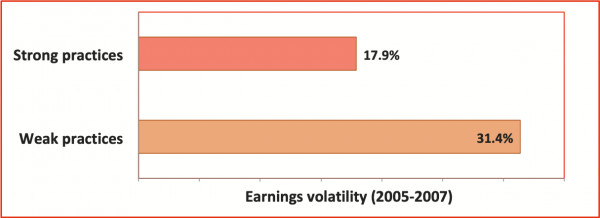
Source: FM Global and Oxford Metrica (2010)
Aon (2017) showed higher risk maturity correlates with lower stock price volatility (Figure 8).
Figure 8: Risk maturity and price volatility
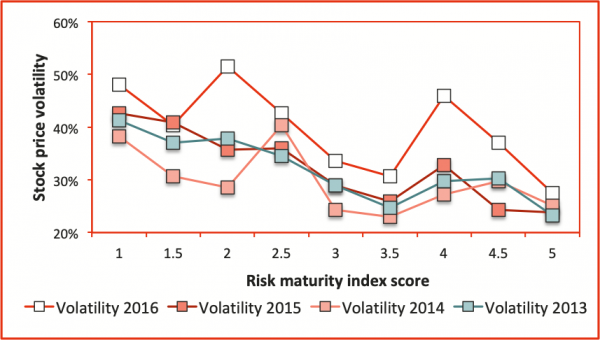
Source: Aon (2017)
Losses, resilience and insurance
FM Global and Oxford Metrica (2010) found that companies with strong physical risk management processes suffered fewer and less severe property losses (Figure 9).
Figure 9: Risk management and property loss severity
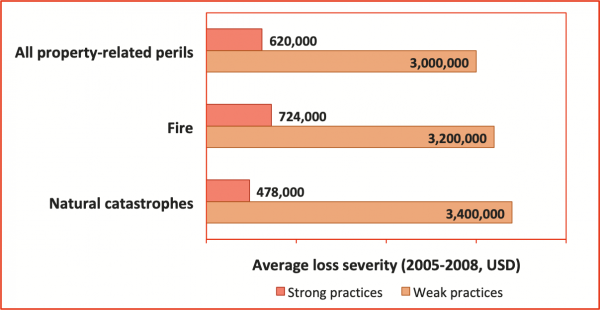
Source: FM Global and Oxford Metrica (2010)
Using the Bloomberg Scenario Function, Aon (2017) showed that a higher risk maturity score correlated with improved resilience to market shocks expressed in terms of smaller share price reductions in the immediate aftermath of a simulated market event (Figure 10). Note that the vertical axis represents negative values; a change in the currency generates a much larger change in market price, so this effect is shown on the right-hand axis.
Figure 10: Risk maturity and resilience to a market shock
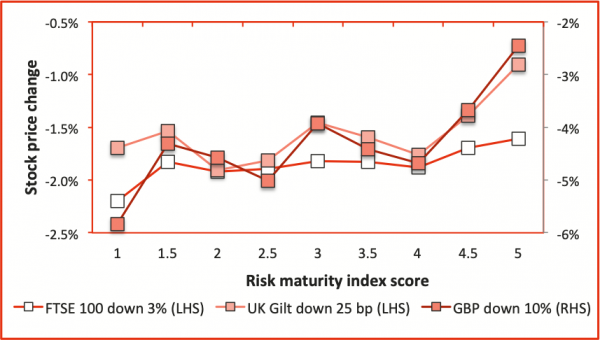
Source: Aon (2017)
Aon (2017) found that 10% increase in a company’s Risk Maturity Index (RMI) score was associated with direct reductions of 2.6% in Directors and Officers (D&O) insurance premiums compared to similar companies, after controlling for other related factors. Taking into account other indirect premium benefits that flow from reduced volatility, the premium reduction was 3.8%. Figure 11 shows how a 10% improvement in scores in some of the characteristics used in Aon’s RMI are related to direct D&O premium reductions (excluding the indirect effects of volatility). Aon’s RMI includes components specifically related to insurance; unsurprisingly, these are associated with significant beneficial effects. These results align with the maxim that the best companies don’t buy insurance, they sell risk.
Figure 11: Risk maturity components and D&O premiums
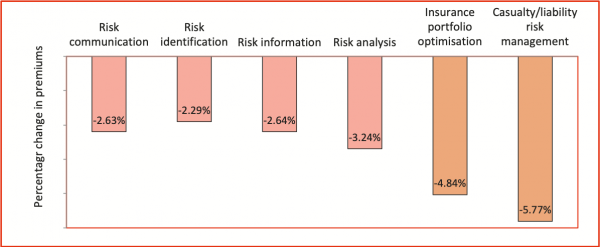
Source: Aon (2017)
Best-in-class analyses
The Aberdeen Group has published several analyses based on comparing groups of companies, often in a triage of best-in-class, industry average and laggards, or leaders (typically the best-performing 35%) and followers (the lower-performing 65%). They have used different metrics to determine groupings, including (among many others, according to the industry sector):
Aberdeen (2013) showed that best-in-class manufacturers demonstrated better operational risk management practices (Figure 12). They also integrated their risk management information systems with other systems, analytics and dashboards (Figure 13), ‘to more easily get the “big picture” view of the state of their manufacturing operations – where the biggest risks lie – and most importantly where they should focus their efforts.’ They showed similar outcomes in a later study, Aberdeen (2016).
Figure 12: Operational risk management in manufacturers
Source: Aberdeen (2013)
Figure 13: System interoperability for risk management
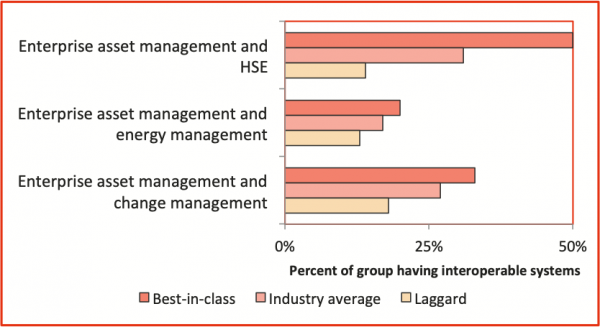
Source: Aberdeen (2013)
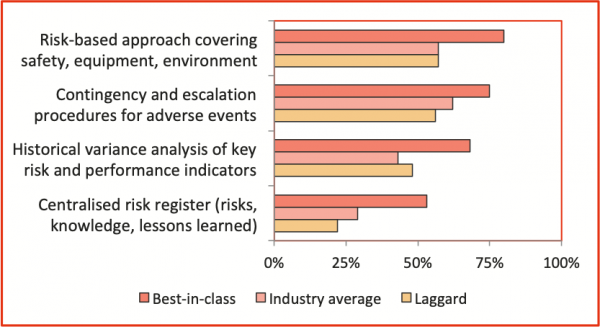
Based on the experience of over 175 respondents, Aberdeen (2015) showed that leading energy companies are far more advanced than energy followers on most risk management metrics (Figure 14). For this study, energy companies included organisations engaged in fuel extraction, manufacturing, refining, independent production (solar, wind, fuel cells, nuclear etc.) and distribution.
Figure 14: Maturity of risk management practices in energy companies
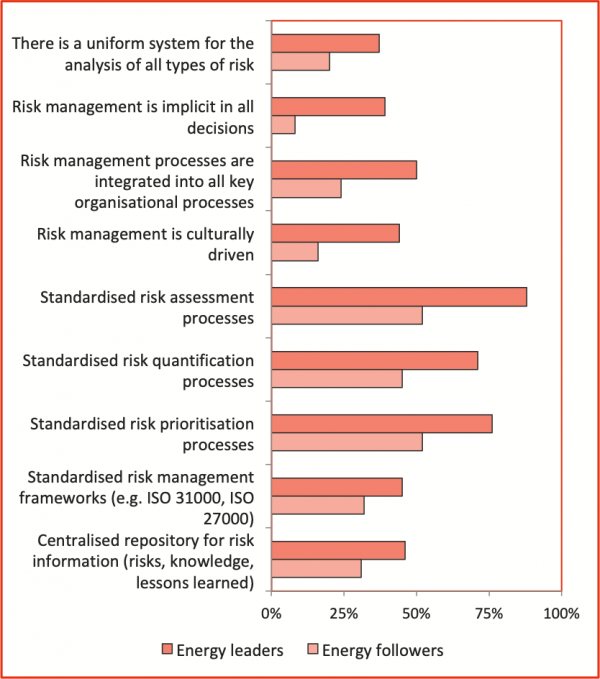
Source: Aberdeen (2015)
Realising the benefits
Table 2 shows our view of some of the business benefits of risk management and the factors that help to generate them. Table 3 outlines some of the characteristics of the way we in Broadleaf approach our consulting work when we advise organisations on how they might enhance their risk management practices, with an indication of how the way we work adds value.
|
What are the benefits |
What aspects of ERM help realise them |
|
|---|---|---|
|
1 |
Enhanced value and resilience of the business |
Greater awareness of threats and opportunities to the company’s objectives, and the processes for dealing with them |
|
2 |
Fewer unpleasant surprises and shocks for the company and its shareholders |
Greater predictability of performance More confidence in the earnings guidance given to shareholders and the market |
|
3 |
Greater shareholder confidence in the company |
A structured and transparent risk management process, directly aligned to the company’s objectives, that supports good governance (an aspect of benefit 1) An ability to demonstrate that shareholder capital is being protected and is being exposed to an appropriate level and type of risk |
|
4 |
An improved organisational culture |
A move away from a prescriptive ‘rule-book’ approach Clear allocation of accountability for material risks and for the assurance of critical controls A requirement for managers to act with foresight and hindsight |
|
5 |
Improved business performance |
Greater risk management effectiveness, through a structured approach that provides more confidence that important threats and opportunities have been identified and addressed appropriately (supporting benefit 1) |
|
6 |
Better and faster decisions, and prudent risk taking |
Better and more focussed information about threats and opportunities, and greater confidence that decisions are being taken on a sound basis (a driver for benefit 5) |
|
7 |
Better allocation of resources and capital |
Agreed risk management standards and guidelines that are applied consistently across the business, thus allowing ‘competing’ risks and treatment requirements to be compared more readily (an aspect of benefit 6 that supports benefit 1) |
|
8 |
Better responsiveness and adaptability in the face of changing circumstances |
Identification, monitoring and review of emerging threats and opportunities and potential drivers of change (an aspect of benefits 5 and 6 that support benefit 1) |
|
9 |
Reduced operational costs and management effort |
A more structured and efficient risk management process, built on existing organisational practices, that reduces effort and allows managers to focus on the things that really matter (supporting benefits 5 and 6) |
|
10 |
Improved organisational learning |
Monitoring and review processes, including post-investment reviews and lessons learned activities, that support the capture and dissemination of knowledge about the drivers of successes and failures (supporting benefit 6) |
|
11 |
Enhanced and more efficient control |
Better priority setting that assists managers (and internal audit) to focus their assurance activities on the controls that are the most critical for the business Fewer redundant, or inefficient controls, because only controls that relate to material risks are needed (supporting benefits 1, 3, 12 and 13) |
|
12 |
Reduced losses and better incident management |
Better identification, analysis and evaluation of what might cause loss of money or assets, or cause harm to people or the environment, leading to better treatment actions and improved controls (supporting benefit 1) |
|
13 |
Reduced insurance premiums |
A transparent and demonstrable process for identifying and treating potential threats, with supporting control improvement and assurance processes (supporting benefit 9) |
|
14 |
Satisfy legal, regulatory and internal compliance and reporting requirements |
A codified and transparent process, with associated reporting on risk management status and improvements (supporting benefit 3) |
|
Our approach |
How that adds value |
|
|---|---|---|
|
1 |
We work with managers throughout the corporate and operating parts of the business |
Our recommendations are tailored to the way in which you work, to ensure the risk management process meets the needs and supports the operational objectives of managers in different parts of the business This enhances ‘ownership’ of the framework, and of the risks and controls, by the managers involved |
|
2 |
We build on existing processes where feasible |
We minimise the changes to existing processes where we can, to build on the current strengths of the company, to ensure there is a close a fit between current and future practice and to minimise unnecessary disruption This also respects the work done to date and encourages ongoing involvement and cooperation by specialists We try to enhance what is there, not replace existing processes completely unless they are irretrievable |
|
3 |
We integrate risk management with existing processes where feasible |
Where possible, risk management processes should be an integral part of day-to-day operations, rather than an add-on; risk management should not impose unnecessary burdens on busy people without corresponding benefits This ensures that risk management is relevant to managers and their decision making needs It also helps ensure that managers are accountable for the management of risks, as this becomes part of their day-to-day activity Integration also assists risk management to become sustainable in the business |
|
4 |
We base our work on the latest standards and on the best practices we have seen elsewhere |
This ‘future proofs’ the organisation’s approach to risk management and ensures it benefits as much as possible from the experience of others |
|
5 |
We help you produce a risk management process and framework that is tailored to your organisation, its risk profile, its context and needs |
We usually conduct a gap analysis, and agree with you where enhancements are necessary This ‘bespoke tailoring’ ensures that you adopt the most effective and efficient approach to managing risks |
|
6 |
Our approach to implementation is tactical and timely |
We try to minimise disruption to the natural flow of work and your calendar of activities We fit in with your strategic and operational planning processes and add value to them rather than delaying or extending them We take advantage of any opportunities that might occur to promote risk management and to demonstrate its benefits to managers |
|
7 |
We work with your specialist staff at all times |
This transfers skills to them and builds their ownership of the framework They will be confident to continue with the implementation of the framework once we have withdrawn |
|
8 |
We ensure that the framework includes processes for continuous improvement |
Once you have made the investment, the framework should be self-sustaining and remain current |
Source material
References
Aberdeen Group (2013) Operational risk management: How best-in-class manufacturers improve operating performance with proactive risk reduction. Aberdeen Group, Waltham MA, USA, March.
Aberdeen Group (2015) Powering the energy industry of the future by mitigating risk. Aberdeen Group, Waltham MA, USA, February.
Aberdeen Group (2016) Optimizing organizational performance with operational risk management. Aberdeen Group, Waltham MA, USA, August.
Annamalah, S, M Raman, G Marthandan and AK Logeswaran (2018) Implementation of enterprise risk management (ERM) framework in enhancing business performances in oil and gas sector. Economies, 6(1), 4.
Aon (2017) Aon risk maturity index. Aon plc, Insight Report, October.
Beals, S, C Fox and S Minsky (2015) Why a mature ERM effort is worth the investment. Risk and Insurance Management Society.
Ernst & Young (2012) Turning risk into results. Ernst & Young, ey.com.
Farrell, M and R Gallagher (2015) The value implications of enterprise risk management. Journal of Risk and Insurance, 82(3), 625-657.
FERMA (2012) FERMA European Risk Management Benchmarking Survey 2012. Federation of European Risk Management Associations.
FM Global and Oxford Metrica (2010) The Risk/Earnings Ratio: New Perspectives for Achieving Bottom-Line Stability. FM Global, Johnston RI, USA.
Gates, S, J-L Nicolas and PL Walker (2012) Enterprise risk management: A process for enhanced management and improved performance. Management Accounting Quarterly, 13(3), 28-38, Spring.
Hoyt, RE and AP Liebenberg (2011) The value of enterprise risk management. Journal of Risk and Insurance, 78(4), 795-822.
Kommunuri, J, A Narayan, M Wheaton, L Jandug and S Gonuguntila (2016) Firm performance and value effects of enterprise risk management. New Zealand Journal of Applied Business Research, 14(2), 17-26.
Nocco, BW and RM Stulz (2006) Enterprise risk management: Theory and practice. Journal of Applied Corporate Finance, 18(4) 8-20, Fall.
McShane, MK, A Nair and E Rustambekov (2011) Does enterprise risk management increase firm value? Journal of Accounting, Auditing and Finance, 26(4), 641-658.
Quon, TK, D Zeghal and M Maingot (2012) Enterprise risk management and firm performance. Procedia – Social and Behavioral Sciences, 62, 263-267.
Rodrigues da Silva, J, A Fernandes da Silva and BL Chan (2019) Enterprise risk management and firm value: Evidence from Brazil. Emerging Markets Finance and Trade, 55, 687-703.
Literature summary
|
Reference |
Companies |
ERM measure |
Performance measure |
Outcomes |
|---|---|---|---|---|
|
Reference |
Companies |
ERM measure |
Performance measure |
Outcomes |
The detailed contents of Table 4 are not included here. They can be found in the pdf version of the tutorial, available here.
Additional information
Dr Dale Cooper was an invited speaker at the Risk Management Institute of Australasia (RMIA) Conference, held in Adelaide Tarntanya on 8-10 May 2023. Details of his presentation Does risk management add value?, which contains additional material and references, are available here.